Money Has a Price

Viewing Today’s Financial World Through the Lens of Credit Analysis

Throughout this Latticework Series, I have been trying to describe the financial world around us by viewing it through the lenses of different disciplines. Behavioral finance helped explain why investors become captivated by narratives. Neuroscience explored why our brains are predisposed to those behaviors. Microeconomics examined how competition shapes the economics of businesses. Financial statement analysis showed how today’s accounting often reflects yesterday’s economic decisions. In this essay, we’ll look at that same world through the lens of credit analysis.

Each discipline directs our attention toward different questions. The facts may remain unchanged, but the perspective alters what we can learn. Behavioral finance draws attention to the ways emotion and cognitive bias influence decisions. Microeconomics focuses on competition, incentives, pricing power, and the allocation of scarce resources. Financial statement analysis asks how economic events flow through balance sheets, income statements, and cash flow statements over time.

Credit analysis offers yet another perspective. It directs attention toward the cost and availability of capital, the strength of balance sheets, the durability of cash flows, and the contractual obligations that must be met before shareholders receive anything at all. By looking through this lens, we’re not necessarily seeking better answers than other disciplines can provide. We’re asking different questions – the answers to which may reveal aspects of the financial world that are otherwise easy to overlook.

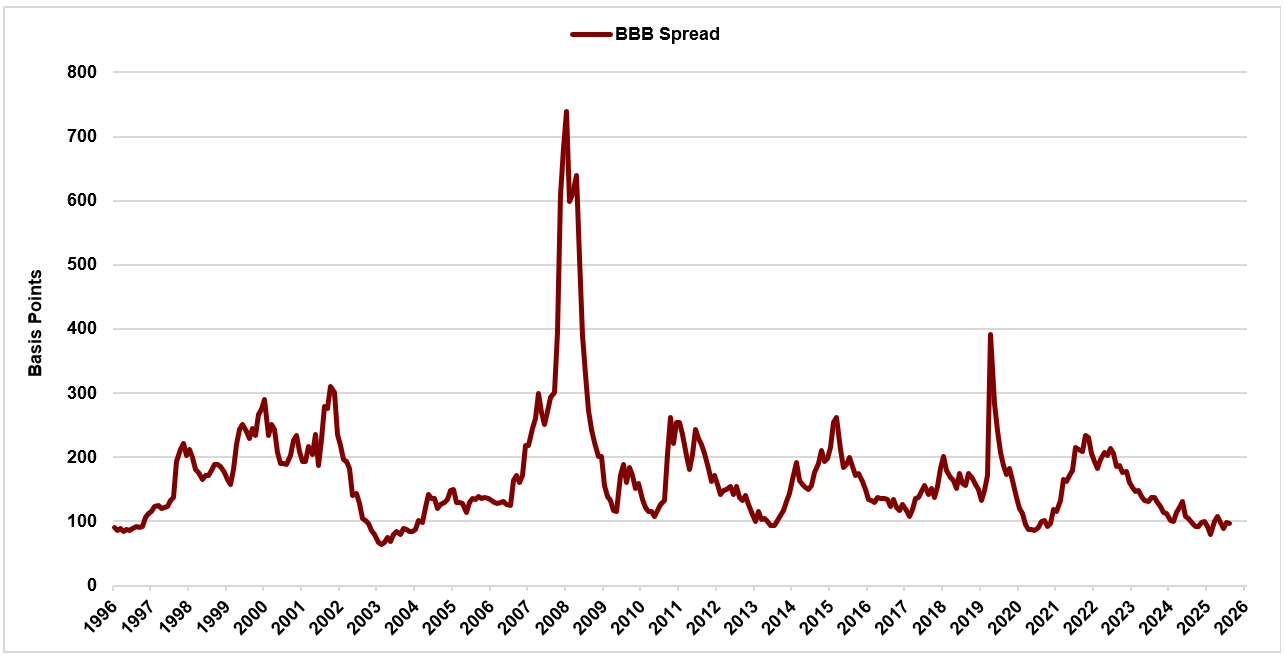
Those questions have become particularly relevant today. The cost of capital has increased materially from the extraordinarily low levels that prevailed for much of the period following the Global Financial Crisis through the pandemic. Government borrowing requirements are growing at an unsustainable pace. On top of that, the current AI buildout represents one of the largest, if not the largest, infrastructure investment programs in U.S. history, inviting comparisons to the railroad buildout of the nineteenth century, the Interstate Highway System, and the Apollo space program. Corporations that once financed investment almost entirely from internally generated cash flow are increasingly turning to the bond market, private credit, project finance, joint ventures, and other forms of outside capital. At the same time, credit spreads across much of the market remain historically tight, even as the riskiest corners have begun showing signs of strain.

To understand what these developments may mean, it helps to begin with the most basic distinction in finance. When an investor buys a share of stock, the investor acquires a residual claim on a business. Employees are paid, suppliers are paid, taxes are paid, interest and principal are paid. Whatever remains belongs to the shareholders.

Debt is different. A lender does not typically participate in the upside a successful business may create. Rather, the lender receives a contractual obligation: interest will be paid on specified dates, and principal will be returned according to agreed-upon terms.

That difference shapes the way equity and credit investors approach the same business. An equity investor may ask how large the opportunity could become, how quickly revenues might grow, whether margins can expand, and how valuable the company might ultimately be. Credit investors start from a different place. What obligations must be paid? What cash flows are available to meet them? How much debt already exists? When does it mature? What assets collateralize the borrowing? What restrictions are in place to protect lenders? Most importantly, what could prevent the borrower from fulfilling its contractual credit obligations?

Equity investors naturally focus on what may go right. Credit analysis starts by asking what could go wrong.

This doesn’t make credit analysis inherently pessimistic. A lender isn’t predicting failure any more than an insurer is predicting an accident. The objective is to identify the risks, determine whether they can be absorbed, and decide what level of compensation is sufficient for bearing them.

That compensation becomes the borrower's cost of debt. It is one important component of the broader cost of capital, but not the only one.

Debt, however, is only one source of capital. Equity capital also has a cost, even though that cost is neither contractual nor as readily observable. When a company issues shares, it receives capital today in exchange for giving new shareholders a permanent proportional claim on the future economics of the business.

Warren Buffett has long approached this tradeoff in especially intuitive terms by thinking of stock as a form of currency. What matters is not simply how much capital a company receives, but how much intrinsic value it gives up in return. Issuing $1 of stock to receive less than $1 of intrinsic value destroys value for continuing shareholders just as surely as overpaying for any other asset. Equity may have no coupon and no maturity date, but that doesn’t make it free.

For now, credit provides the clearest place to begin because the price and terms of debt are more explicit. Interest rates can be observed. Credit spreads can be compared. Maturities, covenants, collateral, and repayment obligations can be identified. Through them, we can see more directly why capital is never truly free.

Capital is often discussed as though it were simply available whenever an attractive opportunity appears. In reality, capital is supplied by someone. A household saves rather than consumes. A pension fund invests assets today to meet obligations extending decades into the future. A bank accepts deposits and makes loans. An insurance company invests premiums it may not need to pay out for decades. An investor buys a bond instead of holding cash or purchasing another asset.

Each provider of capital gives something up. At a minimum, the provider gives up the ability to use that money somewhere else. The longer the commitment, the greater the uncertainty. The less liquid the investment, the more difficult it may be to exit. The weaker the borrower, the greater the possibility of loss.

Capital therefore has a cost for the same reason labor, energy, land, and raw materials have prices. It is scarce, it has competing uses, and those who supply it expect to be compensated.

The simplest starting point is usually described as the risk-free rate. In practice, U.S. Treasury securities are commonly treated as the benchmark because the federal government is considered unlikely to default on obligations denominated in its own currency. Even this so-called risk-free rate, however, is not a single number. Treasury securities mature at different times, and the compensation required to lend overnight is not typically the same as the compensation required to lend for thirty years.

The short end of the yield curve is largely determined by Federal Reserve policy. Longer-term yields reflect expectations about what short-term rates will be in the future, economic growth, inflation, fiscal conditions, and the additional compensation investors demand for committing capital for extended periods. That additional compensation is generally referred to as the term premium.

A lender who commits money for thirty years gives up far more flexibility than one who makes a 90-day loan. Interest rates may change. Inflation may surprise. More attractive opportunities may emerge. Fiscal policy may deteriorate. The supply of competing securities may increase. A lot can change over several decades that cannot be known at the time the investment is made. The term premium compensates investors for bearing that long-duration uncertainty and interest rate risk.

Inflation is related, but it is not identical. Part of a nominal bond yield reflects the inflation investors expect over the life of the bond. Investors may also demand additional compensation for the risk that actual inflation will materially differ from those expectations. That inflation risk contributes to the compensation required for holding long-duration nominal debt, but the term premium reflects a broader set of uncertainties than inflation alone.

Beyond the Treasury rate, most borrowers must pay a credit spread. This is the additional yield investors demand for assuming the risk that a corporation, municipality, household, or other borrower might fail to fulfill its contractual loan obligations.

Credit spreads vary because borrowers differ. A company with stable recurring revenue, modest leverage, substantial liquidity, and few near-term maturities should usually be able to borrow at a lower spread than a company with a more cyclical business model, heavy leverage, limited liquidity, and large refinancing needs. Lenders should demand more compensation from the weaker borrower for the greater possibility of loss.

Other premiums may also matter. A security that cannot be traded easily may require a liquidity premium. A structure that exposes lenders to early repayment, extension, weak or no collateral, or unfavorable contractual options may require additional compensation. The final borrowing cost reflects many separate judgments layered on top of one another.

None of these premiums are fixed in the open market. They change as conditions, expectations, and investor behavior change.

When investors are confident, capital often becomes plentiful and spreads narrow. Lenders accept weaker covenants, longer maturities, less collateral, and lower compensation. When confidence deteriorates, the process reverses. Spreads widen. Documentation strengthens. Amortization increases. Collateral expectations tighten. Some borrowers may discover that capital isn’t just more expensive; it may no longer be available on terms that allow for profitable deployment.

The availability of capital and the price of capital are related, but they are not the same thing. Sometimes capital remains plentiful but becomes more expensive. At other times, quoted borrowing costs appear reasonable while the market quietly becomes less willing to finance weaker borrowers. The most consequential environments often emerge when lenders begin adjusting both price and terms.

This is one reason credit analysis focuses on more than a company’s current interest expense. A business may appear comfortably financed today because its debt was issued years ago at low fixed rates. The more important question may be what happens when that debt matures and must be refinanced.

Refinancing is not a formality. It is a new capital-allocation decision made under whatever conditions prevail at the time. A company that borrowed at 3% may eventually need to refinance at 6%, 8%, or more. Even if the business remains profitable, the higher financing cost reduces the cash available to shareholders, limits management’s flexibility, and may render previously attractive investments uneconomic. If the business model requires continuous access to external capital, the consequences can become even more significant.

This is the point at which credit ceases to be merely descriptive and becomes causal.

Deteriorating credit quality doesn’t just tell us that a company’s economics have weakened. It can weaken them further. Higher borrowing costs reduce free cash flow. Lower free cash flow can lead to ratings downgrades. Downgrades can shrink the pool of potential lenders. A smaller lender base can require higher spreads, more collateral, or stricter covenants. Those changes can force reductions in investment, asset sales, dividend cuts, or new issuance of equity. The financing structure can change the business it was originally created to support.

A recent AI infrastructure project illustrates how quickly this mechanism can become self-reinforcing. The underlying mechanism is far more important than the identity of the company involved. After the project sponsor's credit rating fell below a specified contractual threshold, it became subject to approximately $7 billion of additional collateral requirements. The downgrade didn’t just increase the interest rate on future borrowings. It immediately required billions of dollars of capital to be committed in support of the project itself, reducing financial flexibility and changing the economics of the investment.

The consequences don’t necessarily end there. After the recent downgrade, the borrower's rating stood at the lowest investment-grade level. A further downgrade below that threshold could materially reduce the pool of institutions willing or permitted to lend, increase borrowing costs even further, trigger additional contractual protections, and further increase the company's cost of capital. The resulting reduction in financial flexibility could itself place additional pressure on the company's credit profile. Credit quality would no longer simply describe the economics of the business. It would begin influencing them.

We have encountered this kind of feedback loop before in the Latticework Series. George Soros used the term reflexivity to describe situations in which market perceptions influence behavior, behavior changes fundamentals, and the altered fundamentals feed back into market perceptions. Credit markets are especially fertile ground for this kind of process. Narrow spreads and easy financing encourage borrowing. Additional borrowing changes balance sheets. Changing balance sheets alter credit risk. Credit risk then influences spreads and the future availability of financing. The effect can be stabilizing for long periods and destabilizing when the direction reverses.

Hyman Minsky approached the same broad phenomenon from another direction. He argued that extended periods of stability tend to change behavior. As memories of past losses fade, borrowers and lenders become more comfortable with leverage. Financing structures gradually migrate from those that can be supported by current cash flows toward those that depend increasingly on refinancing, rising asset values, or favorable capital-market conditions. Stability does not merely precede instability. It can help create the conditions that make instability possible.

This does not mean every period of easy credit must end in crisis. Nor does it require us to predict a “Minsky moment.” The more useful takeaway is that financing structures evolve. What appears safe under one cost-of-capital regime may look very different under another.

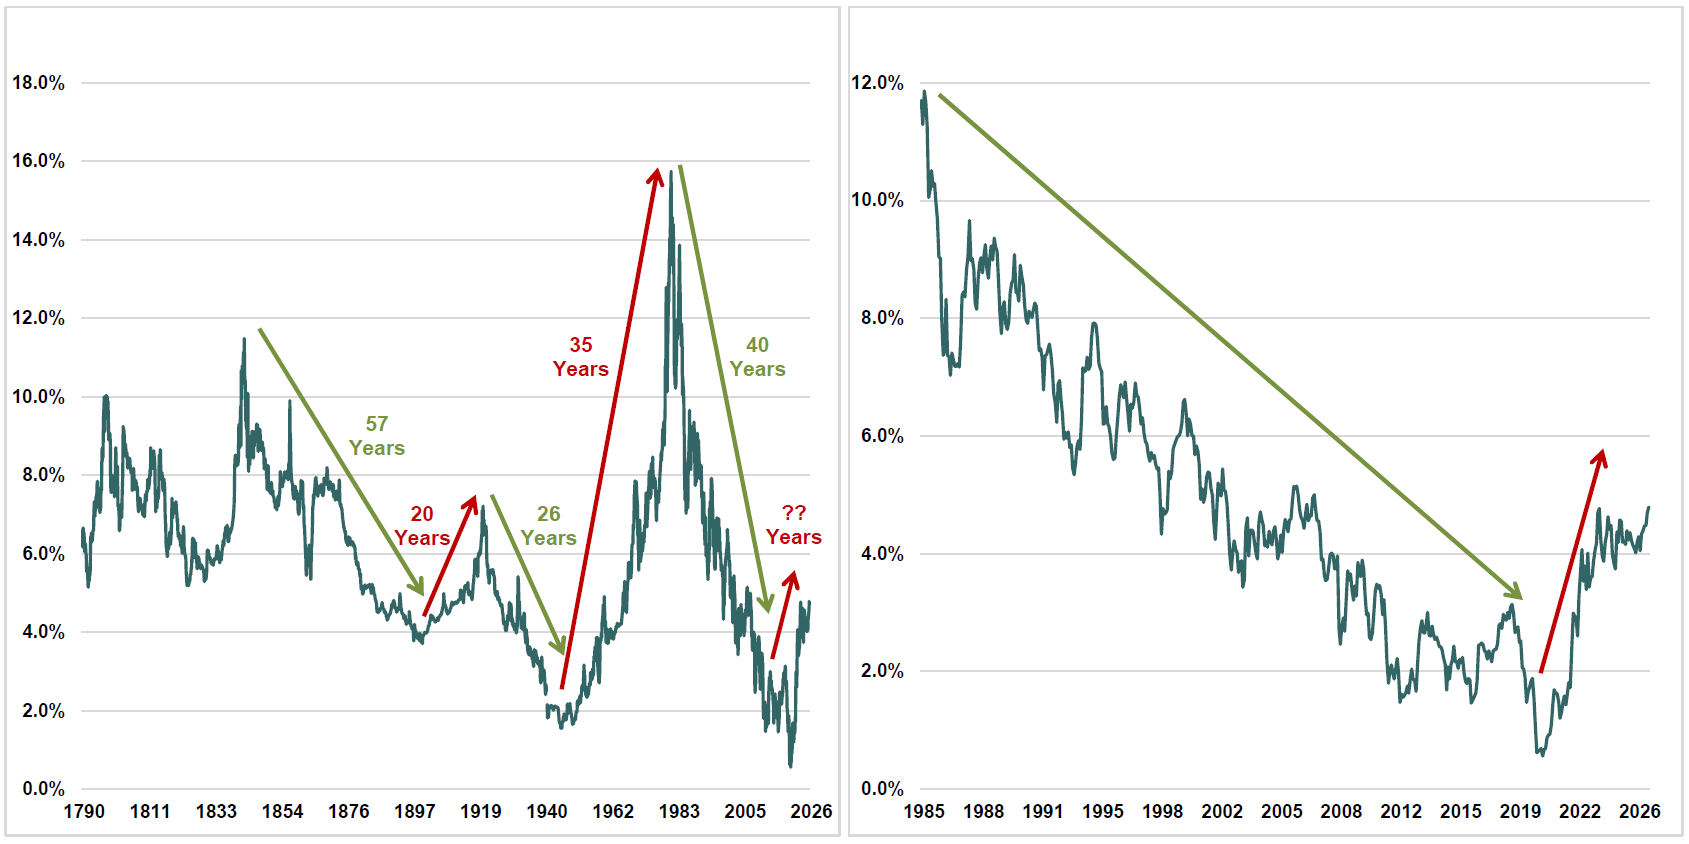
This insight is especially relevant because the investment assumptions shaping today’s capital markets continue to be influenced by one of the most unusual interest rate environments in financial history. Interest rates have always moved in long secular cycles. The great bond bear and bull markets of history have often lasted for decades, reflecting changes in inflation, monetary regimes, demographics, fiscal policy, savings behavior, and confidence in government obligations. The forty-year decline in U.S. interest rates that began in the early 1980s continues to profoundly influence nearly every corner of finance. The two charts below in Figure 4 place today's interest rate environment in its proper historical context and show how the period between the Global Financial Crisis and the pandemic trough culminated in the lowest long-term interest rates in modern U.S. history.

Figure 4: 10-Year Treasury Yield - From 1790-2026 and 1985-2026

Source: FactSet, Bianco Research, SaratogaRIM. See Disclosures.

The charts also illustrate how our perception of "normal" interest rates depends heavily on the reference point we choose. Viewed over centuries rather than decades, it is the extraordinarily low levels reached between the Global Financial Crisis and the pandemic trough – not today's rates – that appear unusual. If the pandemic trough is our reference point, today's interest rates seem high. If two centuries of history are our reference point, it is the pandemic trough that stands out as the anomaly.

In response to the collapse of the financial system and the weak recovery that followed, the Federal Reserve held short-term rates near zero for extended periods and purchased enormous quantities of longer-term securities. These policies were intended to support economic recovery, stabilize financial markets, and lower borrowing costs. They also created an environment in which the cost of capital was suppressed for so long that it eventually came to be viewed as normal.

Behavioral finance refers to this tendency as anchoring. We naturally anchor our expectations to prior experience, even when that experience may no longer provide an appropriate guide to the future. Over time, what we experience becomes incorporated into the mental models we use to understand how the world works – including our assumptions about what constitutes a "normal" interest rate.

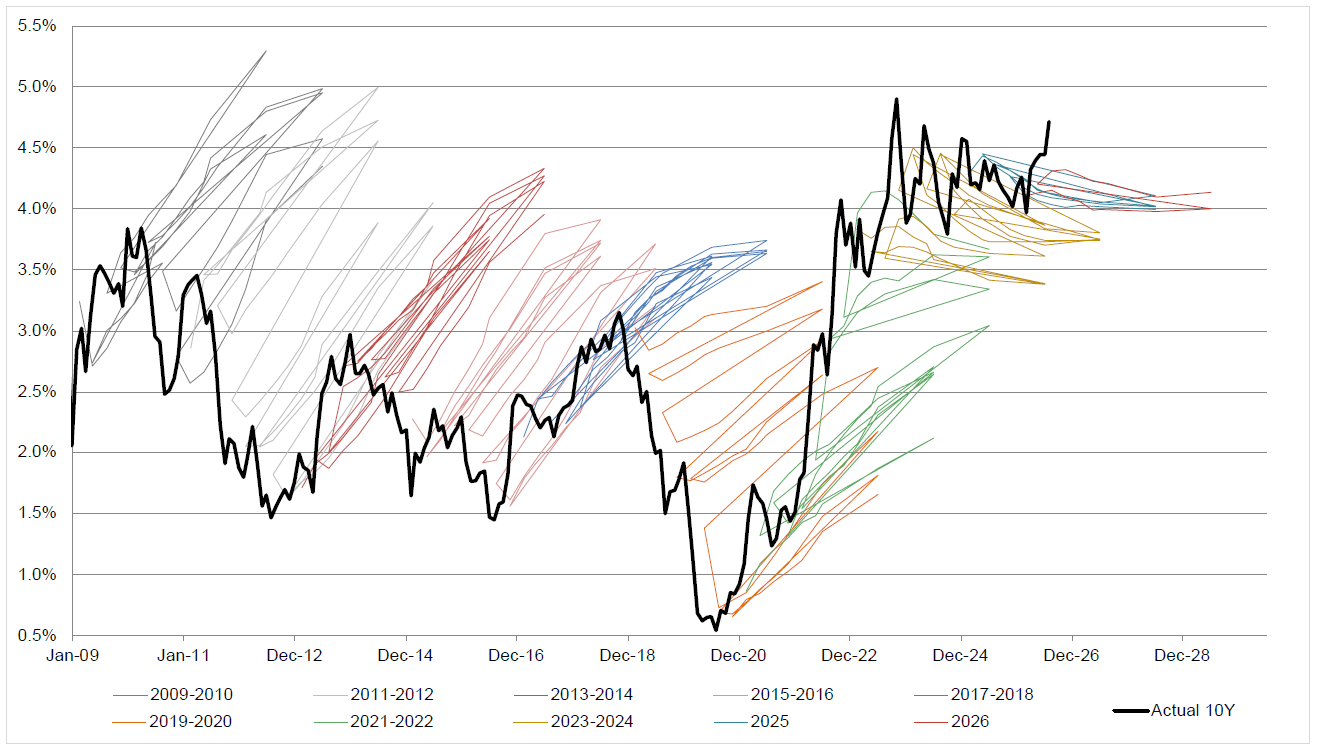
The history of professional interest rate forecasts provides another striking illustration. Throughout much of the great bond bull market, forecasters repeatedly expected long-term interest rates to rise, even as realized yields continued their decades-long decline. At the pandemic trough – the culmination of that extraordinary bull market in bonds – the secular direction of interest rates finally reversed. As inflation surged and yields moved sharply higher, the direction of professional forecasts eventually reversed as well. Forecasters who had spent years anticipating higher rates increasingly began expecting them to fall.

The lesson isn’t just that interest rate forecasts are frequently wrong. It’s that our expectations about the future are inevitably influenced by the economic regimes through which we have lived. In this case, expectations appear to have changed direction only after the underlying interest rate regime had already changed. As experience changes, the models in our minds of how the world works change with it – but often only after the environment itself has begun to shift.

Figure 5: 10-Year Treasury Yield vs. Consensus Forecast Vintages

Source: FactSet, Philadelphia Fed Survey of Professional Forecasters, SaratogaRIM. Black line = actual (FactSet, month-end). Colored lines = SPF consensus forecast paths, one strand per quarterly survey vintage, colored by era (Philadelphia Fed Survey of Professional Forecasters; TBOND mean). Quarterly leg spliced with annual projections; full method and caveats available upon request. See Disclosures.

That recalibration extended well beyond interest rate forecasts. Businesses, governments, and investors increasingly anchored their decisions to a new conception of what constituted a normal cost of capital. Companies refinanced debt at increasingly favorable rates. Private equity sponsors increased leverage. Investors stretched for yield. Long-duration assets rose in value as discount rates declined. Governments found that large deficits could be financed at remarkably low cost. Asset prices came to reflect the assumption that capital would remain abundant and inexpensive essentially indefinitely.

The pandemic initially reinforced those conditions. The Federal Reserve returned rates to zero, financial markets received extraordinary support, and fiscal policy injected enormous amounts of money into the economy.

Yet the pandemic also marked an inflection point.

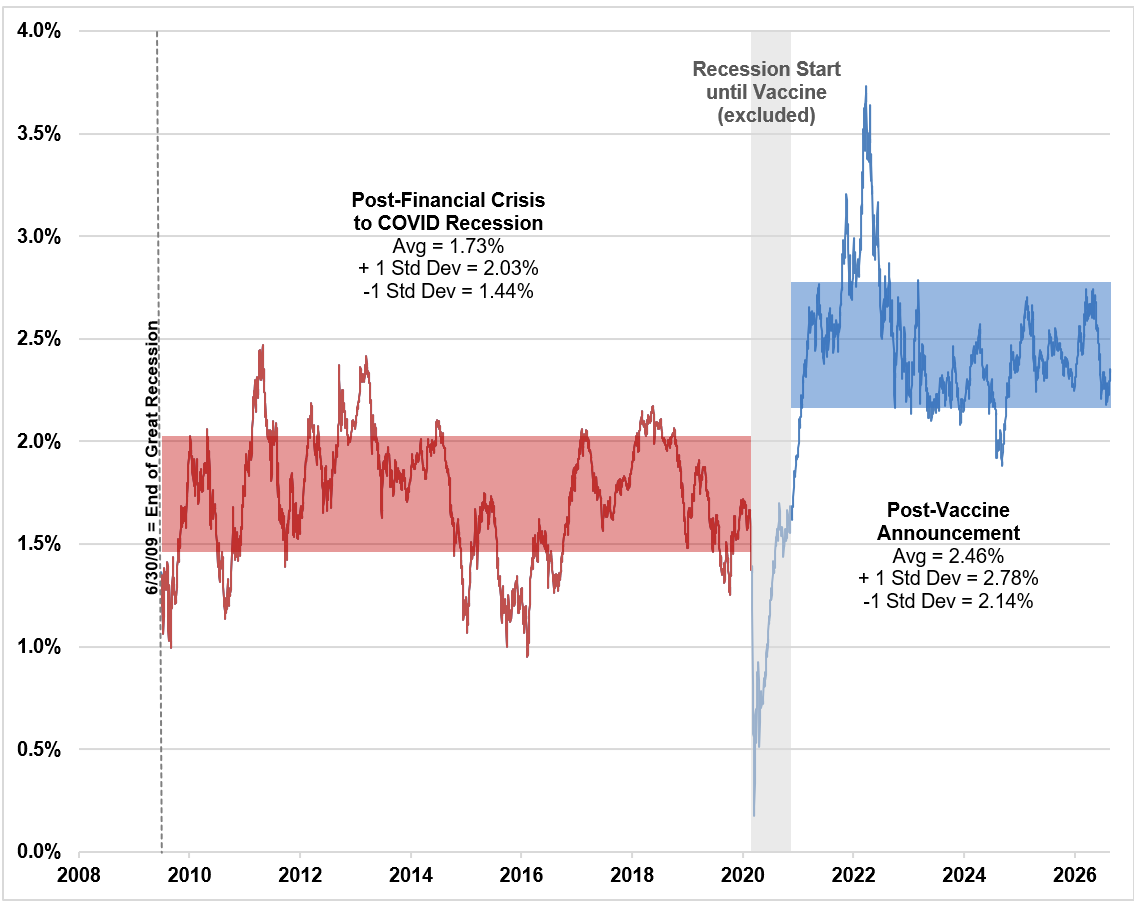
Supply chains were disrupted. Labor markets changed. Government spending surged. Household balance sheets were injected with free money. Demand recovered faster than supply. Inflation, which had been subdued for decades, spiked to its highest point since the 1970s. Although it subsequently declined from its peak, it has settled into a materially higher range. As the chart below shows, the inflation regime has changed.

Figure 6: 5-Year TIPS Inflation Breakeven Rate, Before and After COVID

The Shift to a Higher Inflation Regime

Source: Bloomberg, Bianco Research, SaratogaRIM. See Disclosures.

The Federal Reserve responded by raising policy rates. Interest rates since then have commonly been described as high. That perception is based entirely on the fact that the period that preceded it was a historically low interest rate anomaly.  

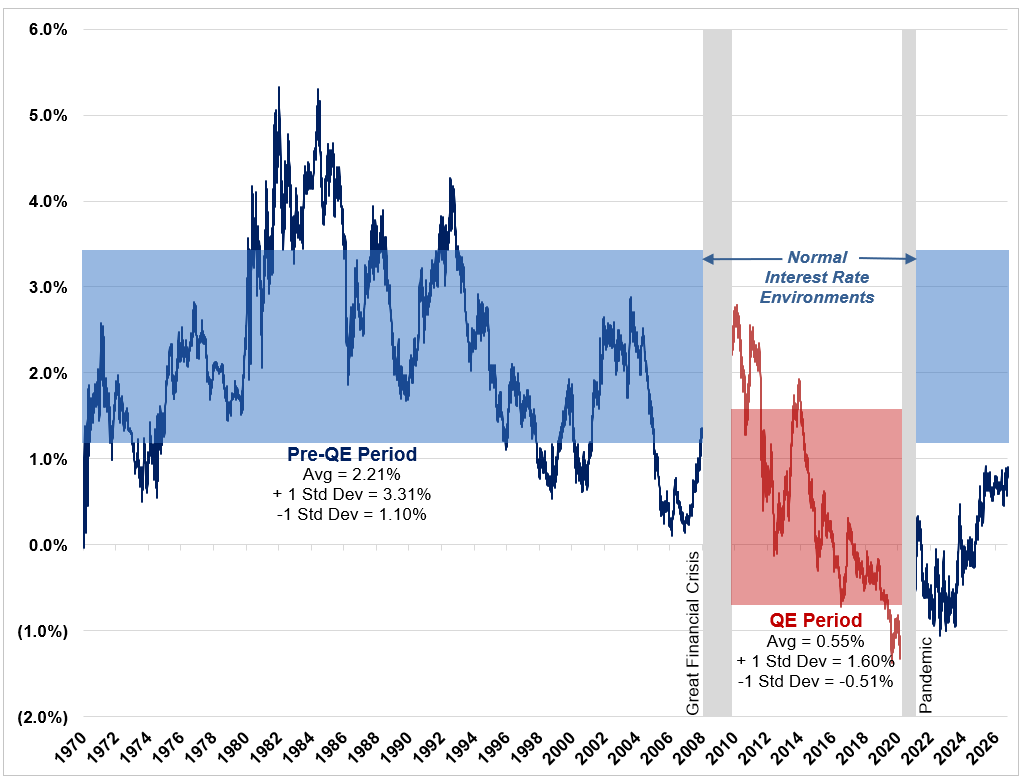
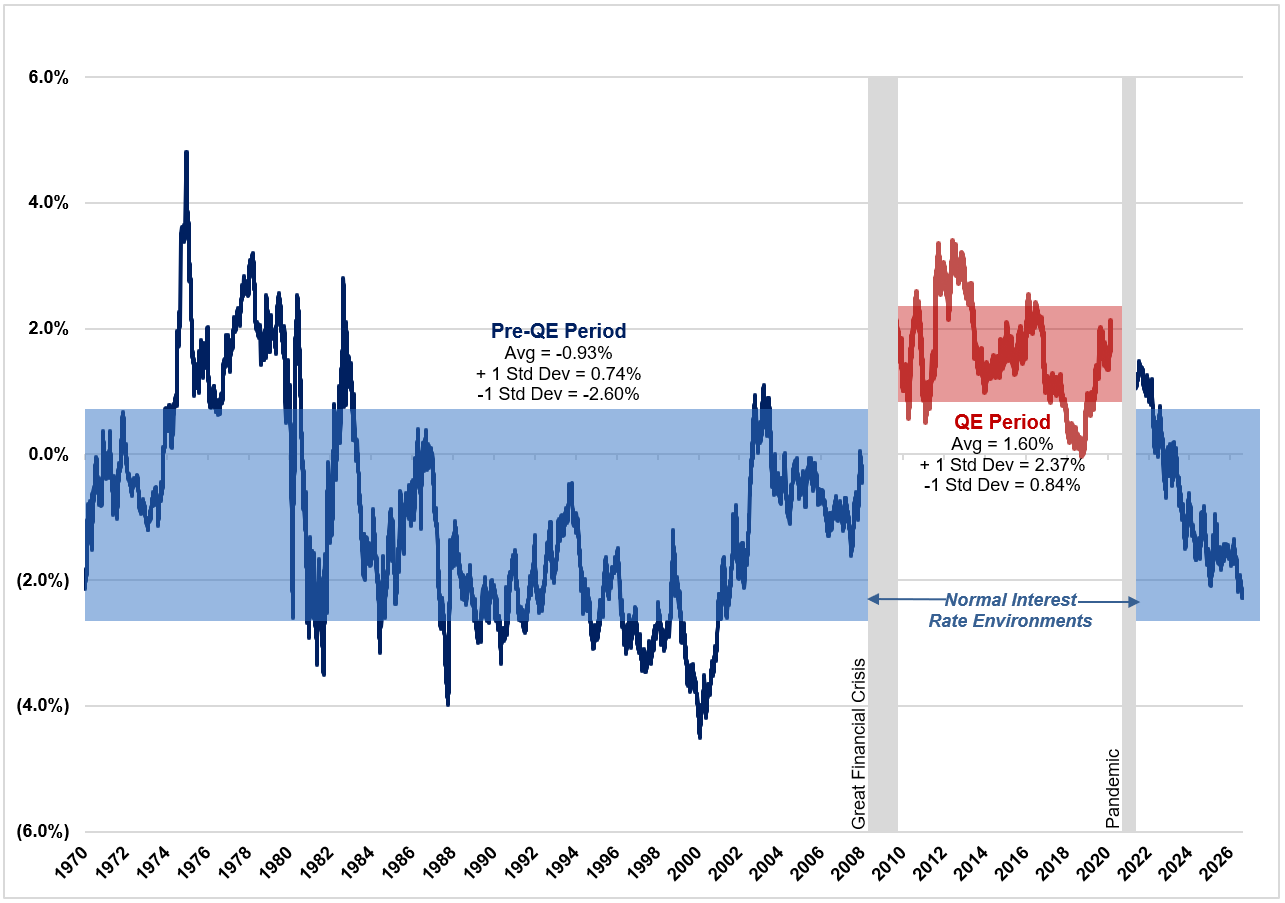
Rates rose dramatically from the near-zero levels that followed the Global Financial Crisis and the pandemic. But direction and level are not the same thing. The short end of the yield curve has largely normalized after a highly abnormal period. At the long end, yields have also risen, but the term premium remains below the levels that were commonly observed as normal before the Global Financial Crisis.

The more accurate description isn’t that interest rates have become historically high. It’s that the cost of capital is normalizing unevenly after an extended period in which virtually all forms of capital were priced unusually cheaply.

For much of the past two decades, investors became accustomed to viewing inflation as primarily a cyclical phenomenon – one that could largely be managed through monetary policy. We increasingly view today's inflationary pressures as structural. Cyclical forces eventually fade. Structural forces can persist for decades.

We continue to believe the environment ahead is likely to differ meaningfully from the one investors became accustomed to following the Global Financial Crisis through the pandemic. Rather than returning to the persistently low and remarkably stable inflation environment that characterized much of the prior two decades, we expect inflation to average closer to 3% to 3½% over time, with greater volatility around that central tendency.

Our view is not based on the business cycle. It reflects several longer-term structural forces that appear likely to persist for years to come, including the powerful combination of deglobalization, demographic change, the unprecedented buildout of AI data center infrastructure, rising defense spending, and persistently high and growing fiscal deficits. Each of these forces increases demand for capital or constrains supply in ways that place upward pressure on inflation and interest rates.

We could certainly be wrong. But if these structural forces prove more durable than markets expect, both the average level and the volatility of inflation – and therefore the cost of capital – may remain materially higher than investors have become accustomed to over the decades following the Global Financial Crisis.

The consequences would extend well beyond inflation itself. The cost of capital influences virtually every important financial decision: which projects are pursued, how businesses are financed, and how investors value future cash flows. A sustained change in its level or volatility would therefore have important implications for capital allocation, corporate profitability, and the valuation of financial assets throughout the capital markets.

It’s important to understand that this ongoing normalization is occurring just as the demand for capital is surging. At the same time, one of the forces that helped make capital so abundant during the 40-year bond bull market has flipped into reverse. For decades, the baby-boom generation accumulated savings for retirement. As the boomers move further into retirement and draw down those savings, what was once a demographic tailwind is becoming a headwind.

Government deficits have become exceptionally large even in the absence of recession. Treasury issuance is increasing accordingly. The energy grid is requiring substantial investment, increasingly driven by the enormous power requirements of AI infrastructure. Manufacturing capacity is being reshored or duplicated as businesses respond to geopolitical risk. Defense spending is rising around the world. Existing corporate debt must be refinanced and infrastructure damaged by age, weather, and underinvestment must be replaced.

To these demands we must now add artificial intelligence. The companies participating in this buildout require semiconductors, servers, networking equipment, land, power generation, transmission capacity, cooling systems, construction labor, engineering expertise, and data centers on a previously unimaginable scale. All of this requires massive amounts of capital.

At first, much of the spending was financed internally by companies with extraordinary profitability and enormous cash balances. Increasingly, however, the scale of the commitments is pushing even some of the world’s strongest companies toward outside financing. According to Bank of America Global Research, the largest hyperscalers have already raised more than $300 billion from the bond market in 2026, more than twice the $136 billion they raised in all of 2025. The bond market, private credit, infrastructure funds, project-finance vehicles, joint ventures, leasing structures, and insurance-backed arrangements are all becoming part of the AI capital stack.

This is where the credit lens adds something that the technology narrative alone cannot. The technological question asks what artificial intelligence may ultimately accomplish. The microeconomic question asks how competition will determine who captures the value created. The financial statement analysis question asks when and how these investments will be reflected in reported financial results. The credit question asks who will supply the capital, on what terms, and at what price.

These are not separate stories. They are different perspectives on the same capital cycle.

In When Monopolies Converge, we examined how formerly distinct technology businesses are increasingly competing for the same customers. Offensive investments by one company become defensive necessities for another. Each may be acting rationally, even if the aggregate result may eventually lead to excessive investment, declining prices, and lower returns on capital.

In Understanding Capital Investment Cycles, we examined how the revenues generated by a capital boom appear quickly in the financial statements of suppliers, while depreciation, interest, maintenance, and replacement costs emerge more gradually for the companies making the investments.

Credit analysis adds another layer. The capital used to finance those investments has its own cost, and that cost can change long before the associated assets have produced their expected returns. This relationship is fundamental. An investment creates value only if the returns ultimately generated exceed the cost of the capital required to finance it.

Yet when investments extend years into the future, the ultimate cost of financing them is often unknown when those commitments are made. Financing may need to be renewed, additional capital may be required, interest rates may change, and credit spreads may widen long before the project begins producing its expected returns. Whether those investments create value will depend not only on the returns they eventually generate, but also on the cost of the capital ultimately required to finance them.

Financial statement analysis reveals the same underlying relationship through the DuPont framework. Leverage can enhance returns to shareholders when a business earns more on its assets than it pays for debt. When the cost of debt exceeds the return generated by those assets, the same leverage works in reverse.

What matters isn’t merely whether an investment produces revenue or accounting profit. What matters is whether it earns an adequate return relative to the capital committed and the risk assumed.

This relationship becomes more important as capital intensity rises. A software business requiring modest incremental investment can make mistakes without necessarily threatening its financial structure. A company committing hundreds of billions of dollars to long-lived physical infrastructure has less room for error. The projects must generate sufficient utilization, pricing, and cash flow to cover depreciation, operating costs, maintenance, and financing over very long timeframes.

Rapid technological change adds another complication. Some lenders financing AI chips are reportedly seeking repayment before the underlying leases expire because newer generations of chips may rapidly reduce the economic value of the equipment serving as collateral. The physical asset may be long-lived even when its economic usefulness is not.

If the cost of capital rises while expected project returns remain unchanged, fewer investments create value. If competitive pressure simultaneously reduces future margins, the hurdle becomes even higher.

The financial world around us therefore presents a striking contrast. On one side, the demand for capital is expanding rapidly. Governments are borrowing heavily. AI infrastructure requirements are exploding. Energy, defense, manufacturing, and refinancing needs are all competing for the same pool of savings.

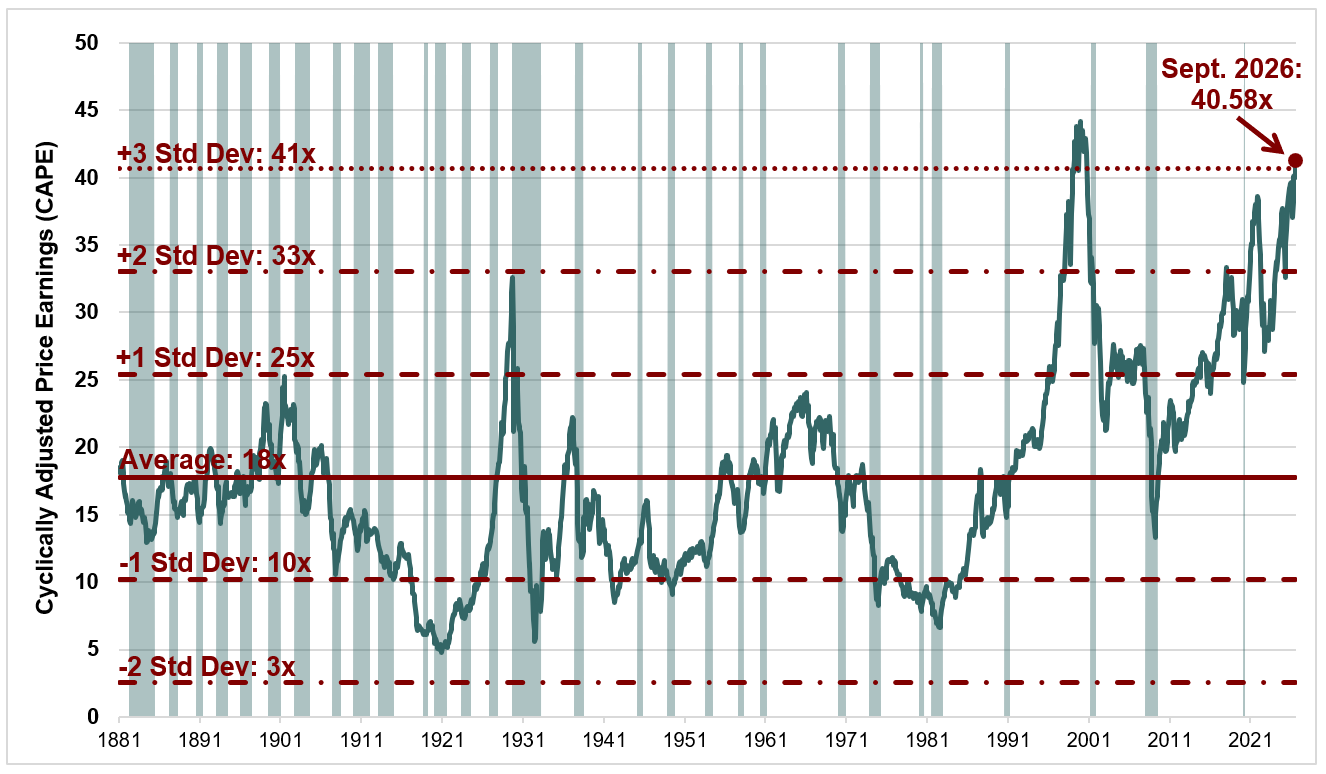
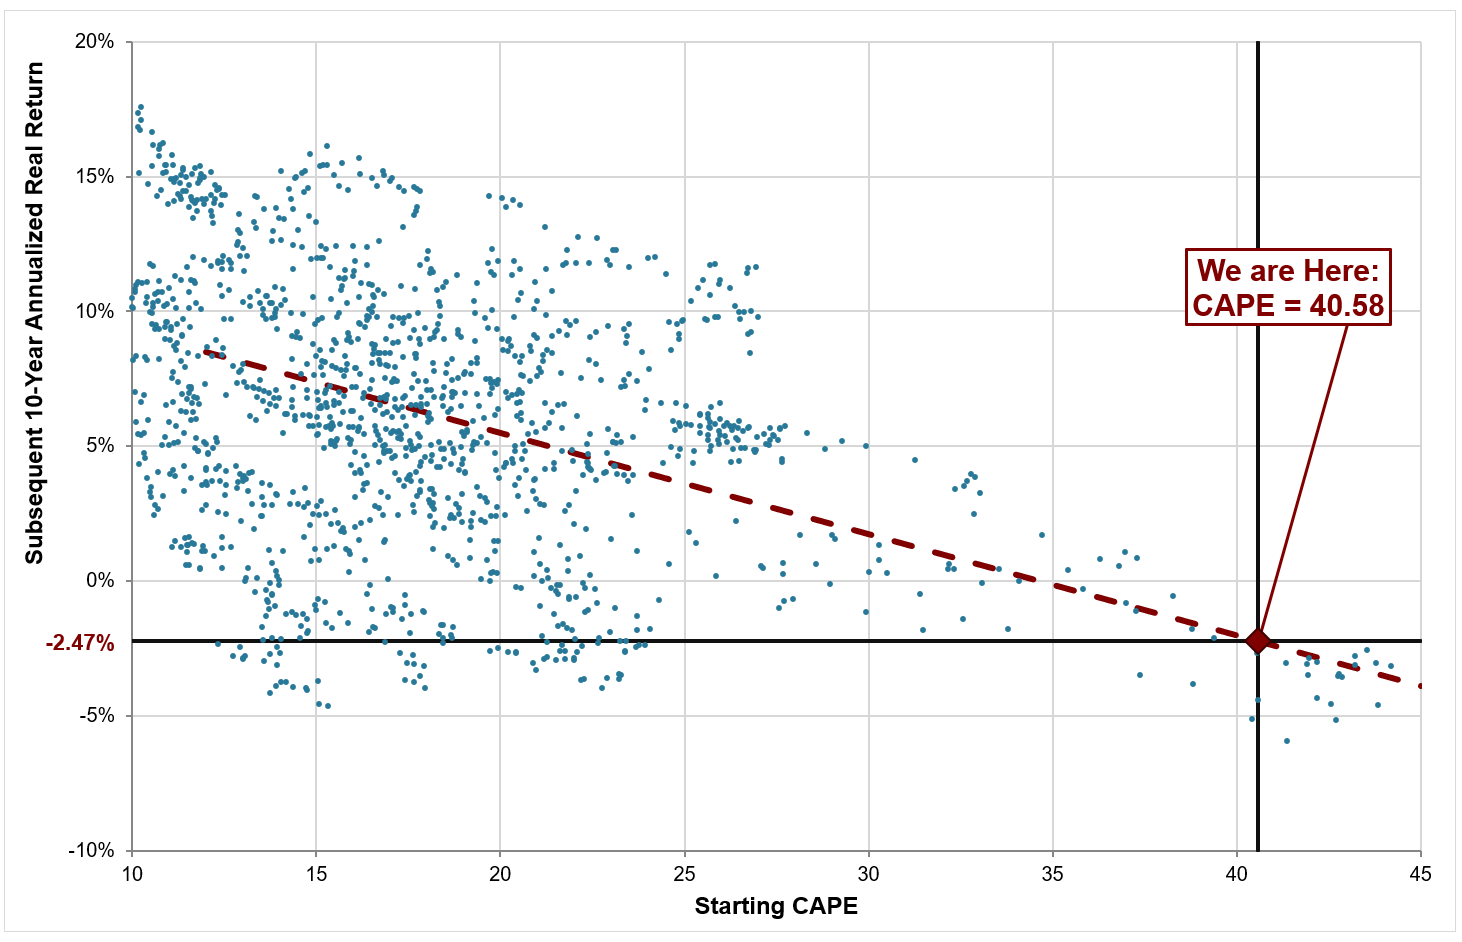
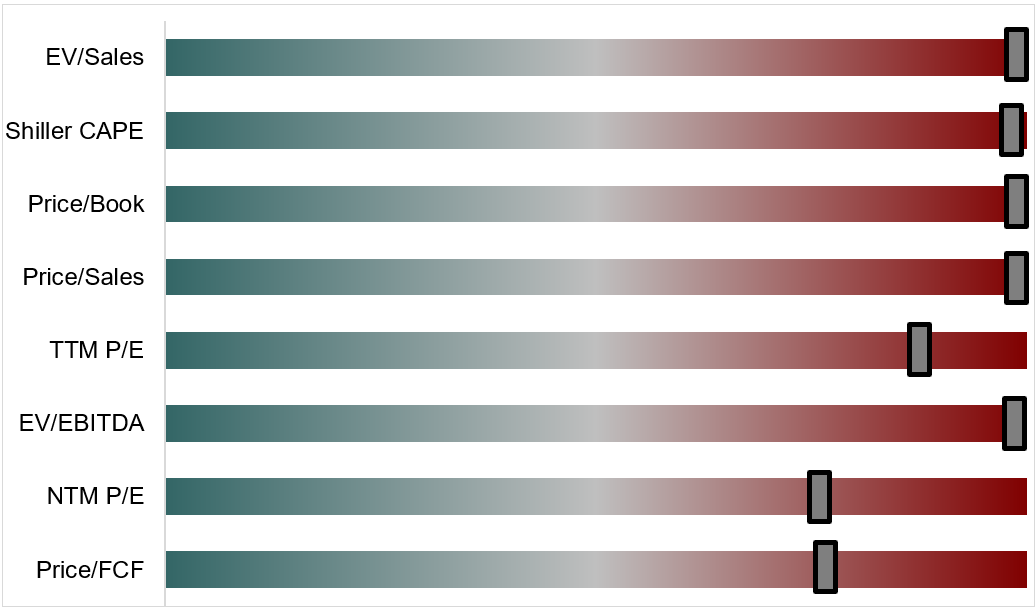
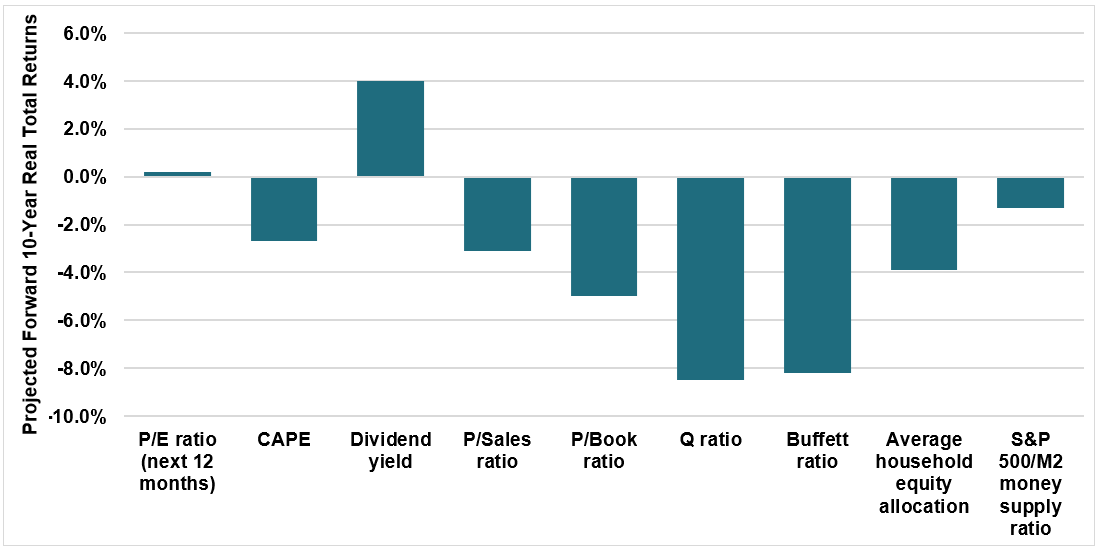
On the other side, much of the credit market continues to offer investors relatively modest compensation. Spreads remain tight across large parts of investment-grade and high-yield credit. The long-term Treasury term premium, while rising, still remains below the pre-GFC norm. Equity valuations remain historically elevated.

None of this proves that markets are wrong. Strong corporate balance sheets, healthy nominal growth, abundant liquidity, continued access to financing, investor demand, and confidence in future productivity may justify some of today’s pricing.

The credit lens nevertheless helps us to see the tension. The quantity of capital being demanded is surging. The uncertainty surrounding inflation, fiscal policy, geopolitics, technology, and future returns is increasing. Yet the compensation available for bearing many of those risks remains remarkably low.

Beneath the surface of the credit market, investors are beginning to discriminate more carefully among borrowers. Broad investment-grade spreads remain historically tight, but significant dispersion is emerging within individual rating categories. Spreads have widened materially among the weakest borrowers, even as stronger credits continue to enjoy relatively favorable financing conditions, while the enormous volume of hyperscaler issuance is itself beginning to affect relative pricing across the market. Loan investors are starting to demand stronger covenants, more amortization, tighter collateral protection, and better documentation. Credit-default-swap markets are also increasingly distinguishing among the likely winners and losers of the AI buildout.

These developments don’t yet constitute anything remotely resembling broad financial stress. But they may represent something more subtle: the beginning of discrimination. And just perhaps, an early warning signal that investors are becoming less willing to accept the unusually modest compensation on offer for bearing risk.

During periods of abundant liquidity, capital markets often treat borrowers as though differences in balance sheet strength don’t matter very much. When conditions change, those differences reassert themselves. Companies with strong cash flows, modest leverage, and financing flexibility have optionality. Companies dependent on continual refinancing discover that the cost and availability of capital can change their strategic options very quickly.

This is why we have always considered financing risk one of the three primary sources of permanent capital loss, alongside business-model risk and valuation risk. Business-model risk asks whether the economics of the company will endure. Valuation risk asks whether the price paid already assumes more than the business can deliver. Financing risk asks whether the capital structure can survive long enough under stress for the underlying economics to even matter.

A great business can be impaired by excessive leverage. A promising investment can fail because financing disappears before the opportunity is realized. A company may possess valuable assets and still be forced to sell them at the wrong time because contractual obligations leave management with no alternative.

The order of claims matters most when things don’t go according to plan. When times are good, the distinction between debt and equity can seem almost academic. Interest payments are made easily, principal is refinanced, and shareholders participate in growth. During periods of stress, the capital structure becomes decisive. Contractual claims get paid first. Residual claims absorb anything that’s left.

This is also why liquidity must be distinguished from solvency. A company may own assets whose long-term value exceeds its liabilities and still fail if it cannot meet obligations when they come due. Conversely, a company with substantial cash may remain liquid for some time even while its business model steadily deteriorates. Credit analysis examines both questions because time is part of the obligation.

The contractual nature of credit imposes discipline. Debt matures. Interest must be paid. Covenants may be tested. Collateral may be pledged. Ratings can change. Lenders can refuse to refinance. Equity can wait; credit often can’t.

This discipline can make credit markets valuable sources of information. Bond yields, credit spreads, loan prices, ratings actions, and credit-default swaps may begin reflecting changes before those changes become visible in reported earnings. Even though we’re primarily equity investors, we take all of these factors into consideration.

As we discussed in Understanding Capital Investment Cycles, financial markets don’t wait for the second accounting clock to catch up. Credit markets may begin pricing financing pressure while income statements still reflect the profitability of an earlier business model.

That doesn’t mean bond investors are always right or that credit markets invariably lead equities. Credit markets are also influenced by liquidity, regulation, institutional constraints, technical flows, and human behavior. Prices contain information, but they are not the same thing as information. They still require interpretation.

That question – how financial markets incorporate information, risk premiums, and required returns into asset prices – belongs to the next lens in this series. For now, the more important lesson is that capital has a cost.

That cost begins with the compensation required to postpone consumption and give up flexibility. It rises with time, uncertainty, illiquidity, contractual weakness, and the possibility of default. It changes as the supply of savings and demand for financing change. It influences which projects get built, which companies can compete, which business models remain viable, and ultimately which capital structures survive.

The cost of capital doesn’t just determine what businesses are worth. It helps determine which businesses survive.

For much of the period following the Global Financial Crisis, unusually inexpensive capital has influenced nearly every part of the financial system. It has encouraged borrowing, inflated asset prices, reduced financing costs, and led governments, businesses, and investors to make decisions under the assumption that capital would remain cheap and plentiful forever.

That world has already changed.

The short end of the yield curve has largely normalized. Adjustment at the long end has been more gradual. Government financing requirements are expanding at an unsustainable pace. The AI infrastructure buildout is absorbing capital on a historic scale. Lenders are beginning to distinguish more carefully among borrowers. The price and terms of financing are starting to become important again.

None of this can tell us what happens next. Credit analysis can’t predict the future any more than behavioral finance, microeconomics, or financial statement analysis can. Its value lies elsewhere. It reveals obligations, dependencies, and feedback loops that other perspectives may not pick up on. It reminds us that growth requires financing, that leverage can magnify both success and failure, and that capital remains available only so long as someone is willing to provide it on acceptable terms.

Having explored why capital has a cost, the next question is whether markets have priced that cost correctly.


Editor’s Note

This essay is part of our ongoing Latticework Series, which examines today’s investment environment through the lenses of multiple disciplines. Previous essays explored behavioral finance, neuroscience, microeconomics, and financial statement analysis. This essay approaches the same broad questions through the lens of credit analysis, focusing on how the cost and availability of capital influence businesses, markets, and investment outcomes.

Complex investment problems rarely yield to a single discipline. Our objective is not to replace one framework with another, but to build a broader latticework of mental models in which each discipline contributes insights that the others cannot.

The next essay in this series, Pricing the Unknowable, will examine these same questions through the lens of financial theory. It will explore how modern finance came to define and measure investment risk, whether those measures capture the uncertainties that matter most to long-term investors, and what it means to price a future that cannot be known with precision.

Understanding Capital Investment Cycles

Financial Statement Analysis and the Two Clocks of Capital

By Kevin Tanner | Chairman | CEO | Chief Investment Officer

Every great capital investment boom is exciting while it lasts.

Prosperity is seemingly everywhere. New factories are built, workers get jobs, suppliers receive orders. Revenues rise and earnings surge. Whole industries suddenly flourish. The resulting optimism feels entirely justified because, at least initially, nearly everyone connected to the capital spending boom seems to benefit. History suggests that every major capital investment cycle follows this same pattern – one that has repeated across industries and generations.

Today's artificial intelligence (AI) buildout provides a particularly striking contemporary example. Semiconductor manufacturers are reporting record revenues. Memory producers are enjoying extraordinary pricing power. Companies that make servers, networking equipment, electrical infrastructure, cooling systems, transformers, and power generation equipment are struggling to keep up with demand. Engineering firms are designing massive data center campuses while construction companies are racing to build them. Utilities are committing billions of dollars to expand generating capacity, while developers are searching for suitable sites around the world. Quarter after quarter, businesses supplying the AI ecosystem have continued to report results that exceed expectations.

The impact extends well beyond the companies directly supplying AI infrastructure. Harvard economist Jason Furman estimated that data center construction accounted for approximately 92% of U.S. GDP growth during the first half of 2025. Since then, the AI infrastructure buildout has only intensified. For now, at least, there appears to be no end in sight.

Today’s earnings surge is, at least in part, being driven by this enormous capital investment boom. The first-order effect is straightforward: capital spending by one company becomes revenue and earnings for another. But that income doesn't stop there. Suppliers hire workers, purchase inputs, expand capacity, and make investments of their own, turning the income created by the original spending into additional spending elsewhere.

This creates a multiplier effect as the workers they hire and the businesses they buy from spend and invest some of that income themselves, creating successive rounds of spending and income that ripple throughout the economy. These second-order effects allow the earnings benefits of the boom to spread far beyond the companies receiving the initial orders.

The scale of this investment boom is truly remarkable. Technology companies have collectively spent, or committed to spend, more than a trillion dollars on artificial intelligence infrastructure already, with announced capital expenditure budgets growing almost monthly. Yet even those extraordinary figures understate the scale of the commitments being made. Increasingly, companies are also entering into long-term contractual commitments – including leases, purchase agreements, and energy contracts – that extend many years into the future.

Financing these commitments has required firms that historically relied primarily on internally generated cash to increasingly tap both the equity and debt markets. Some have announced secondary offerings measured in the tens of billions of dollars. Others have materially increased leverage to finance data centers, specialized semiconductors, networking equipment, and power infrastructure on a scale rarely seen outside of traditional industrial businesses. Increasingly creative financing structures are also expanding the pool of capital available to finance the buildout even further. Companies once celebrated for their asset-light business models are rapidly becoming some of the world's largest investors in physical infrastructure.

Taken together, these developments have produced one of the largest capital investment waves in modern history. Yet something about the resulting prosperity deserves closer attention. While the earnings benefits of this enormous investment are spreading throughout the economy, the companies making the investments themselves remain highly profitable today despite unprecedented capital spending. Financial markets have rewarded both groups, reinforcing the impression that the investment boom is generating extraordinary prosperity almost everywhere and all at once.

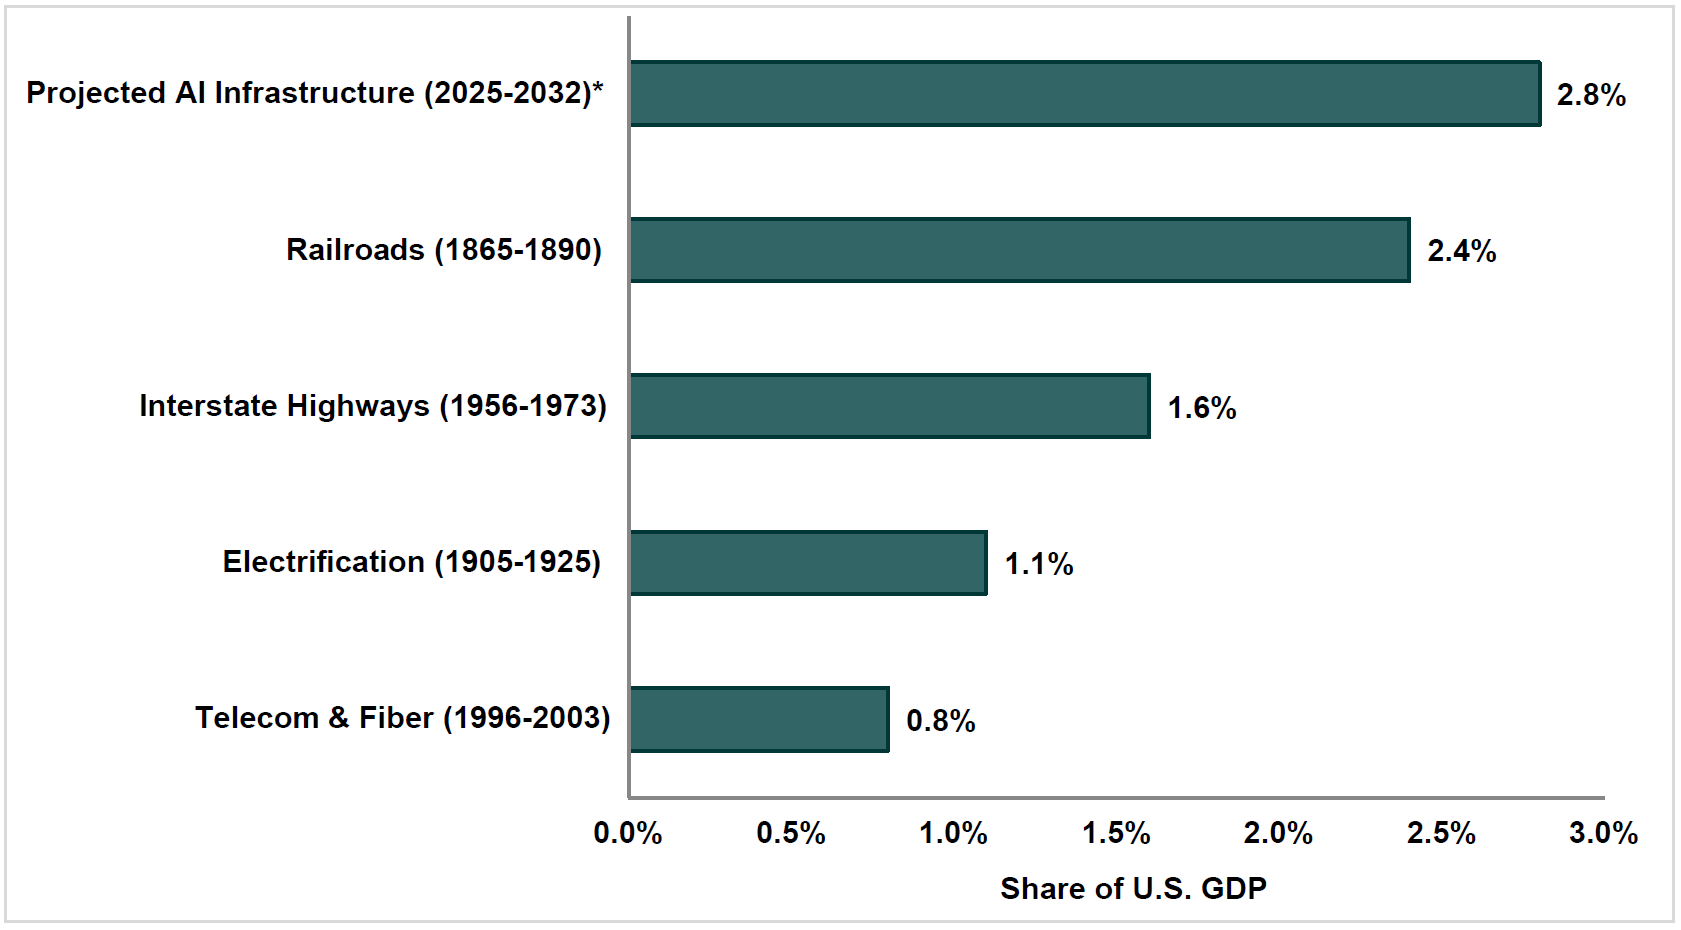
History suggests there is nothing unique about this pattern. Railroads generated enormous demand for steel, locomotives, bridges, and construction. Electrification transformed manufacturing while creating vast opportunities for equipment suppliers and utilities. The dotcom boom produced unprecedented orders for fiber-optic cable, networking equipment, and switching hardware. Today's artificial intelligence boom has followed a remarkably similar path.

Figure 1: Average Annual Investment During CAPEX Booms as a Share of U.S. GDP

The Projected AI Buildout Would Rival America’s Largest Infrastructure Booms

Source: SaratogaRIM, using data from Stijn Van Nieuwerburgh, "Financing the AI Buildout," Columbia Business School Working Paper, March 19, 2026. Historical infrastructure episodes are shown as realized average annual investment as a share of U.S. GDP over the periods indicated. The AI infrastructure figure (*) is a forward-looking estimate based on projected U.S. investment required to support anticipated artificial intelligence computing infrastructure. Comparisons are intended to illustrate the relative scale of investment rather than predict actual expenditures or investment outcomes. See Disclosures.

There is nothing mysterious about any of this. Transformative innovations stimulate investment, generate economic growth, and produce strong earnings. Yet that explanation is incomplete. The remarkable feature of the beginning phase of nearly every major capital boom is that prosperity appears to spread almost everywhere simultaneously. Suppliers flourish while the companies making the investments continue reporting robust earnings despite unprecedented capital expenditures. Investors reward both groups, reinforcing the perception that an entire economy has suddenly become more profitable. Eventually, however, as the surge in capital expenditures subsides, that dynamic begins to reverse.

Why does this boom-and-bust cycle happen so consistently?

As noted earlier, part of the answer is economic. Capital investment creates income that ripples throughout the economy. But another important part of the answer lies in the way financial statements recognize investment.

Every major capital investment starts two financial clocks simultaneously – one for the companies supplying the investment and one for the companies making it. The first begins the moment capital is deployed, as the capital investment immediately becomes revenue for companies throughout the supply chain.

The second begins at the same moment but unfolds gradually over many years as the companies making those investments begin recognizing depreciation, financing costs, maintenance, and the ongoing economic burden associated with the new assets they have created. The accounting is doing exactly what it was designed to do. The two clocks are simply measuring different stages of the same economic process.

Understanding these two clocks helps explain one of the defining characteristics of every major capital investment boom. During the expansion phase, the economic benefits of new investment begin flowing almost immediately through the financial statements of the companies supplying the goods and services needed to build the new capacity. The associated economic costs, however, emerge much more gradually through depreciation, financing costs, maintenance, and other operating costs recognized in the financial statements of the companies making those investments. As a result, suppliers are recognizing much of today's economic benefits while the companies making those investments have yet to recognize much of tomorrow's costs. Neither set of financial statements is wrong. This timing difference explains why prosperity appears so broadly and simultaneously during the expansion phase.

This asymmetry has important implications for financial statement analysis. During ordinary periods, these timing differences tend to be much less significant. During one of the largest capital investment booms in modern history, however, they can temporarily make an entire economy appear considerably more profitable than it will on the other side of the cycle. Understanding where businesses sit within that investment lifecycle is therefore one of the central challenges facing investors during major buildouts.

For the companies supplying the goods and services that make the investment possible, the accounting is straightforward. A semiconductor manufacturer ships chips and recognizes revenue. A construction company completes part of a new data center and records sales. An engineering firm bills for design work. Utilities recognize revenue by supplying the power required for AI data centers. Each participant in the supply chain records revenue and, assuming the work is profitable, reports higher earnings almost immediately. Their financial statements reflect the economic benefits generated by the investment as the work is performed.

The investment flows through the investing company's financial statements very differently. Rather than recognizing the expenditure immediately as an expense, much of the spending is capitalized on the balance sheet as property, plant, and equipment. The accounting follows a fundamental principle of financial reporting: costs should generally be recognized during the periods in which they generate economic benefits. A data center expected to operate for decades should not reduce earnings only in the quarter it was built. Instead, its cost is allocated gradually over its useful life through depreciation.

That treatment is neither aggressive nor misleading. In fact, it is precisely what financial accounting is intended to accomplish. The matching principle exists because immediate expensing would produce a distorted representation of economic performance, depressing current earnings while overstating profitability in future periods. Earnings should reflect the productive use of long-lived assets, not just the timing of the cash outlay required to acquire them.

Yet this same accounting treatment has profound consequences during periods of extraordinary capital investment.

While suppliers recognize the economic benefits of new investment immediately, most of the associated cost has yet to be recognized by the investing company. Even after the data center becomes operational, only a small portion of its cost has been recognized through depreciation. Most of the depreciation and, if it has been financed with debt, interest expense still lie ahead. The facility must also be staffed, maintained, repaired, powered, cooled, insured, and ultimately replaced. None of those future costs are absent from the economics. They simply emerge over a much longer timeframe than the initial revenues generated throughout the supply chain.

As a result, the financial statements of many different companies can simultaneously portray improving profitability even though they reflect different stages of the same investment lifecycle.

This distinction is easy to overlook because most investors naturally focus on the income statement. Quarterly earnings dominate financial headlines, management discussions, and analyst estimates. Thorough financial statement analysis, however, requires a broader view. The balance sheet, income statement, and statement of cash flows are not independent reports. They form an integrated accounting system. In financial statement analysis, this relationship is known as articulation. A single economic event ultimately appears on all three financial statements, but often at different times and in different forms. Understanding how economic events migrate through the financial statements over time lies at the heart of good financial statement analysis. During ordinary periods, those relationships can seem routine. During extraordinary investment booms, they become essential to understanding what the financial statements are – and are not – telling investors.

The current artificial intelligence investment cycle provides an unusually clear illustration of articulation in practice. Reported net income continues to rise. Capital expenditures have accelerated to unprecedented levels. Yet free cash flow is already starting to tell a noticeably different story. None of these financial measures is incorrect. Understanding how – and why – they can all be true simultaneously is precisely what financial statement analysis seeks to explain.

Figure 2: Net Income, Capital Expenditures, and Free Cashflow of “Hyperscalers” (AMZN, GOOGL, META, MSFT, ORCL) and Semiconductor Companies (NVDA, MU, AVGO, AMAT) from 2010-2025

Source: FactSet, BofA Research Investment Committee, SaratogaRIM. See Disclosures.

The implications extend well beyond accounting. Without an understanding of these dynamics, investors often come to expect that companies with high margins, exceptional returns on invested capital, and abundant free cash flow will sustain those financial characteristics indefinitely.

Extraordinary capital investment can fundamentally alter the economics of the business itself. Companies that once generated extraordinary returns through relatively non-capital-intensive operations may suddenly find themselves investing hundreds of billions of dollars in data centers, electrical infrastructure, networking equipment, and specialized semiconductors. Assets accumulate rapidly on the balance sheet. Depreciation becomes a much larger component of future operating costs. Interest expense grows as companies increasingly supplement internally generated cash with debt financing. Future maintenance capital expenditures become a far more significant claim on cash flow than they were during the company's earlier stages of development.

Many of these investments may ultimately create substantial long-term value. That, however, isn’t the central issue. The point is simply that the financial characteristics of these businesses are changing along with their underlying economics. Historical measures of profitability, capital intensity, leverage, and free cash flow conversion may no longer reflect the economics that businesses are likely to exhibit over the next decade.

This distinction becomes particularly important during periods of rapid technological change. Investors naturally focus on the remarkable earnings being generated today, but today's earnings can sometimes reflect yesterday's business model rather than the evolving economics that will shape tomorrow's financial statements. As the investment cycle progresses, depreciation increases, maintenance requirements expand, financing costs accumulate, and competition intensifies as new capacity comes online. By the time those changes become fully visible in reported financial statements, investors have often shifted their attention to an entirely different set of questions, and market prices may have adjusted long before the accounting tells the full story.

Accounting and financial markets also often operate on different timelines. Financial statements recognize many costs gradually as assets are depreciated and financing costs emerge over time. Financial markets, however, often begin reassessing those future obligations much earlier. As leverage rises and financing requirements expand, credit markets frequently lead that reassessment as bond yields and credit spreads begin adjusting well before the associated costs become fully visible in reported earnings. Financial markets don't wait for the second clock to catch up. They begin pricing those economic consequences long before the accounting fully reflects them.

This phenomenon is not unique to artificial intelligence. Every major capital investment cycle follows a remarkably similar pattern. The technologies change, the accounting doesn’t.

The railroad boom of the nineteenth century generated extraordinary demand for steel, locomotives, bridges, engineering services, and construction. Suppliers prospered as railroads expanded across continents. Railroads initially reported strong growth as new lines opened and traffic increased. Yet the economic consequences of those enormous investments continued unfolding long after the initial construction boom had passed.  Depreciation, maintenance, financing costs, and growing competition gradually transformed the industry's economics in ways that would have seemed almost inconceivable at the height of the boom.

Electrification followed a remarkably similar path. The buildout created tremendous opportunities for manufacturers of generators, turbines, transmission equipment, copper wire, and industrial machinery. Entire industries experienced years of exceptional growth as factories modernized and electrical infrastructure expanded. Once again, suppliers recognized the immediate benefits while the long-term costs of operating, maintaining, and replacing those assets unfolded only gradually over subsequent decades.

This pattern repeated itself during the dotcom boom of the late 1990s. Manufacturers of fiber-optic cable, networking equipment, switches, routers, and optical components experienced explosive demand as companies rushed to build the internet's physical backbone. Financial statements throughout the supply chain reflected extraordinary profitability. Once again, it was only after investment had slowed and excess capacity became apparent that depreciation, financing costs, and intense competition abruptly reshaped the economics of the industry.

The artificial intelligence boom around us today appears to be following this same pattern. Whether the ultimate outcome proves more successful than previous investment booms remains to be seen. Technology may ultimately transform the global economy in ways that exceed today's expectations. The point isn’t that these investments will fail. The point is that the economic consequences of today's extraordinary capital investments will unfold over time much as they have during every major investment boom that preceded it.

This distinction becomes particularly important when evaluating businesses whose economics are undergoing fundamental change. Many of today's largest technology companies built their businesses around remarkably asset-light business models. High margins, exceptional returns on invested capital, modest capital expenditure requirements, and abundant free cash flow became defining characteristics of the industry's most successful firms. Investors have understandably come to view those financial characteristics as essentially permanent.

Increasingly, companies once known primarily for software, digital advertising, and cloud services are becoming owners and operators of enormous physical infrastructure. Data centers, specialized semiconductors, electrical systems, cooling equipment, networking hardware, and power generation are no longer peripheral investments. They are becoming central to the competitive landscape.

Moreover, the investment requirements increasingly extend beyond the data centers themselves. As rapidly growing demand for computing capacity strains existing power systems, additional investment in generation, transmission, and electrical infrastructure is expanding both the scale of the capital cycle and the economic consequences that will ultimately flow from it.

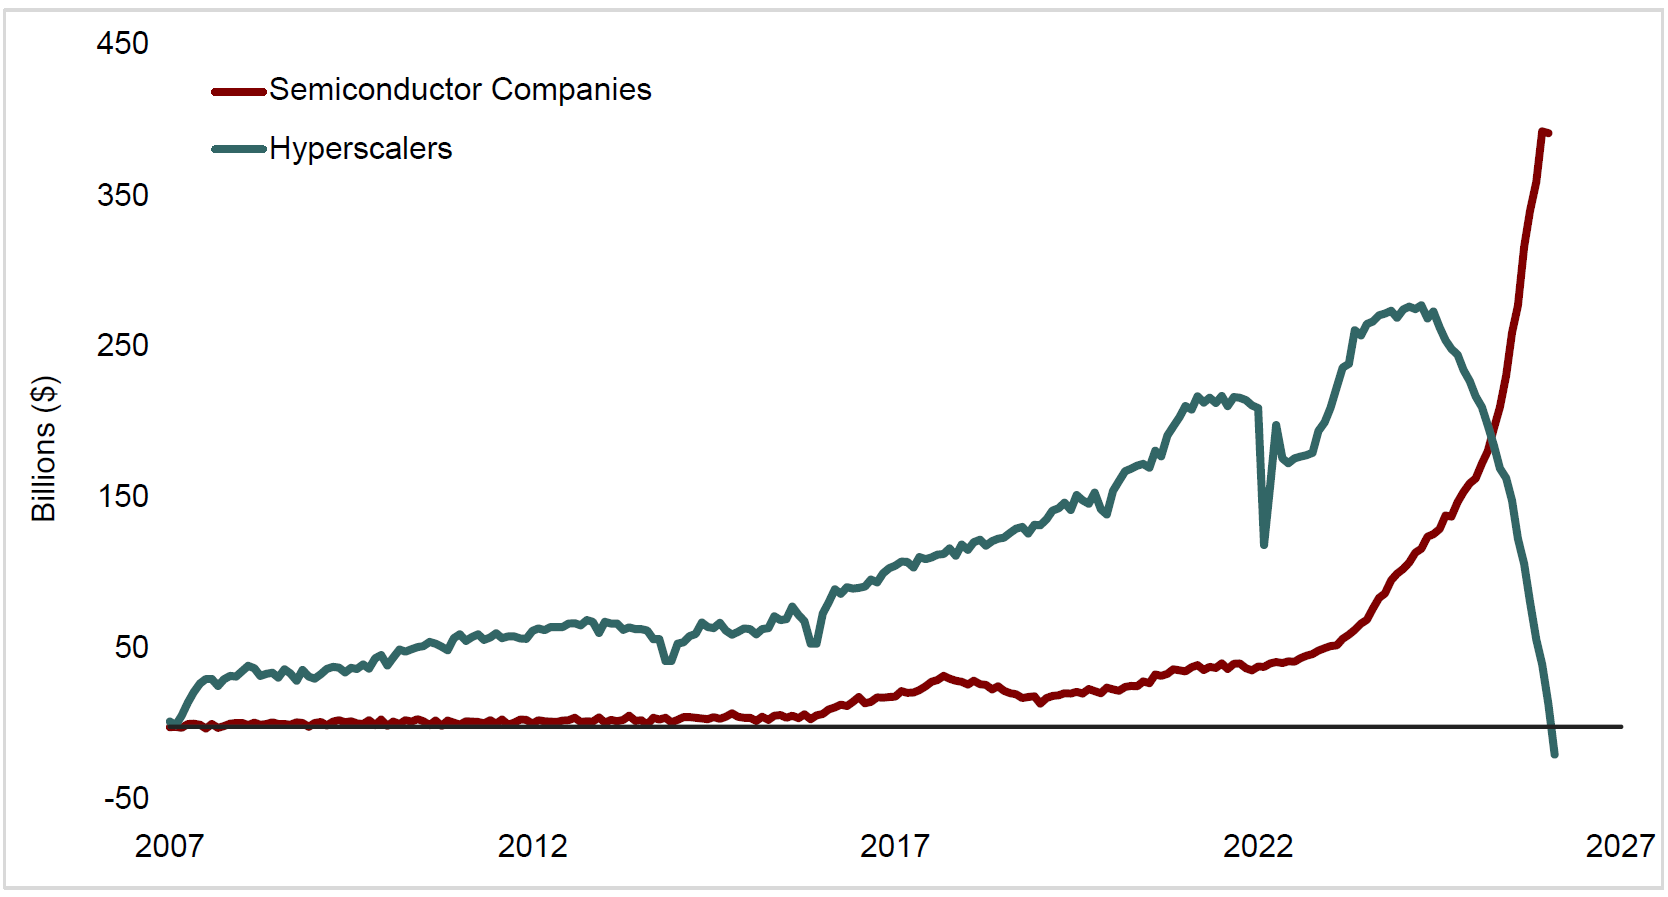
Financing these investments has required not only unprecedented levels of capital expenditure, but increasingly the use of both debt and equity financing by companies that historically relied far more heavily on internally generated cash. The effects of this investment cycle are already becoming apparent in the way free cash flow is migrating across the AI value chain.

Figure 3: Rolling 12-month Forward Free Cash Flow (in Billions) of "Hyperscalers" (AMZN, GOOGL, META, MSFT, ORCL) and Semiconductor Companies (NVDA, MU, AVGO, & AMAT)

A generational transfer in free cash flow is taking place.

Source: SaratogaRIM, derived from chart created by BofA Research Investment Committee. See Disclosures.

The chart illustrates how the migration in free cash flow is a natural consequence of these investments. Capital expenditures are recorded immediately as cash outflows by the companies making the investments, reducing free cash flow, while those same expenditures become revenues, earnings, and ultimately free cash flow for the companies supplying the goods and services needed to build the new infrastructure.

The assets created by those capital expenditures accumulate on the investing company’s balance sheet as property, plant, and equipment, gradually giving rise to depreciation, financing costs, and future maintenance requirements. As those assets begin operating over their useful lives, they will produce progressively higher depreciation expense. Interest expense will rise as leverage increases, while maintenance capital expenditures will eventually consume a larger share of future cash flow.

These changes have important implications for financial statement analysis. Ratios that investors have long associated with exceptional businesses, including asset turnover, free cash flow conversion, and returns on invested capital, are not permanent attributes of a business. They are observations drawn from particular points in time, reflecting the economics of the business as it existed then. When those economics change, the associated financial ratios often change as well, reflecting a fundamentally different business model rather than deteriorating execution.

Investors who mechanically extrapolate yesterday's profitability into tomorrow may overlook the possibility that the business generating those earnings is no longer the same business it once was.

None of this suggests that artificial intelligence will prove disappointing. Quite the opposite. Railroads permanently transformed transportation. Electrification reshaped manufacturing. The internet revolutionized communication and commerce. Society ultimately benefited enormously from each of these investments, even if the financial returns ultimately earned by shareholders varied widely. The critical question is therefore not whether artificial intelligence creates value. It is whether investors fully appreciate how – and when – both that value and its associated costs will emerge in financial statements. Most importantly, it is whether, after massive runups over recent years, today's market prices already assume more future value than the underlying economics ultimately support.

Here is where financial statement analysis becomes more than an exercise in calculating ratios or projecting earnings. The objective is not merely to estimate next quarter's results more accurately than everyone else. It's to understand a business well enough to recognize when the financial characteristics that once defined it are beginning to change. Over time, investors who understand how the costs associated with capital investments gradually migrate from the balance sheet to the income statement are often far better positioned than those who focus exclusively on where earnings are likely to come in relative to consensus expectations.

This distinction has become particularly relevant during today's artificial intelligence investment boom. The issue isn't whether today's technology companies in aggregate will continue creating enormous value, but how some of their rapidly evolving business models will reshape their future financial characteristics. This is a key risk for long-term investors to consider.

Every capital investment cycle eventually reaches a point at which the pace of new investment begins to slow. Markets become saturated, financing becomes more expensive, demand proves less robust than anticipated, or companies simply conclude that enough capacity has already been built. Whatever the cause, the first clock inevitably begins to slow. The second clock, however, continues gathering momentum.

Once construction slows, the economics of the investment don't simply disappear. The factories and data centers continue operating. Equipment still requires maintenance. Interest expense remains an obligation until debt is repaid, while depreciation continues reducing reported earnings regardless of whether demand ultimately meets expectations. Years of capital investment continue generating economic consequences long after the pace of new investment begins to slow.

This is the point at which the relationship between the two clocks begins to reverse. During the expansion phase, the first clock produces an immediate surge in revenues for companies selling into the investment boom while the second clock has only begun recognizing the costs borne by the companies making those investments. As the pace of new investment moderates, however, the first clock slows while the second often continues accelerating as completed projects enter service and begin generating depreciation, maintenance, financing, and other operating costs. Revenues respond quickly. The bulk of expenses arrive much later.

Importantly, capital investment does not even have to decline for the first clock to begin slowing. What matters to suppliers isn’t just the level of investment, but the rate at which that investment is growing. Capital expenditures can continue reaching new records even as the incremental demand they create starts to slow. For suppliers whose financial statements have benefited from years of accelerating investment, that deceleration alone can materially change the trajectory of revenues and earnings.

The effects can become considerably more pronounced as the cycle turns. During the boom, rapidly rising demand can push against available capacity, increasing utilization, strengthening pricing power, and expanding supplier margins. Those unusually attractive economics encourage suppliers to add capacity of their own. Because that capacity takes time to build, however, it may not become available until the growth in investment spending has already begun to slow.

On the other side of the cycle, the financial effects can therefore reverse surprisingly quickly. As new supply brings capacity closer to equilibrium with demand, utilization can fall, pricing power can weaken, and margins can contract. Supplier earnings may then deteriorate much faster than the underlying level of investment would suggest, even while absolute capital spending remains historically high. There is a reason these types of massive capital investment cycles have so often been described as boom-and-bust cycles.

Together, these dynamics help explain why the transition from boom to bust often feels so abrupt. Investors frequently attribute the deterioration to a sudden change in sentiment or an unexpected economic shock. In reality, the financial statements may simply be reflecting a different stage in the life cycle of the same investments. Supplier revenue growth can slow and margins can contract just as depreciation, maintenance, financing, and other costs associated with years of investment become increasingly visible elsewhere in the financial statements.

For investors, recognizing this transition may be even more important than forecasting the next quarter's earnings. During the expansion phase, it is relatively easy to identify the companies benefiting most from rising investment. The more difficult task is recognizing when the first clock is beginning to slow while the second continues gathering momentum. By the time that transition becomes fully visible in reported financial statements, investors have often moved on to an entirely different narrative.

Perhaps the most valuable application of financial statement analysis is understanding how, why, and when the underlying economics of a business are changing – and recognizing those changes before they become fully apparent in the financial statements. Reported earnings are important, but they rarely tell the entire story. As businesses evolve, so do their balance sheets, financing structures, capital intensity, and operating economics. Financial statements faithfully record every stage of that evolution, but the significance of those changes often becomes apparent only over time.

Major capital investment booms make this challenge particularly difficult because they encourage investors to extrapolate recent experience far into the future. Rising revenues, expanding margins, and optimistic guidance reinforce one another, creating the impression that today's financial characteristics are permanent features of the business, even as the business model generating them may itself be changing.

For thoughtful investors, however, recognizing the transformative potential of a technology is only the beginning of the analysis. Equally important is understanding how the economics of that transformation will be reflected in financial statements over time. Suppliers and the companies making the investments may both report strong earnings simultaneously while operating on very different clocks. Distinguishing among them requires more than forecasting earnings growth. It requires understanding which clock each company is operating on.

Every major investment boom is different. The technologies change. The participants change. The opportunities change. Yet one characteristic remains consistent. Capital continues to operate on two clocks. One measures the immediate benefits created by new investment. The other records the costs that unfold gradually over years or even decades. Understanding the relationship between those two clocks cannot tell investors precisely how a particular investment boom will unfold, nor can it identify the eventual winners and losers with certainty. It can, however, provide a more complete framework for interpreting financial statements as businesses, industries, and investment booms evolve over time.

In the end, that’s the most important lesson. Financial statements do far more than record economic events. They reveal where those events reside in time. In normal periods, that distinction may seem unimportant. During extraordinary investment booms, it can shape the way investors perceive an entire economy. The numbers themselves are rarely the challenge. The greater challenge is recognizing which clock you’re reading – and of course, what time it is.


Appendix

The two clocks of capital illustrate one important implication of financial statement analysis: reported earnings often reflect where economic events reside in time. But timing is only part of the story. Financial statements also translate economic events through accounting rules, classifications, estimates, and judgments. The appendix that follows explores two recent examples of how that translation can materially affect reported earnings.

Reading Between the Lines of Financial Statements

How Accounting Rules and Management Judgment Shape Reported Earnings

Financial statements are among the most important tools available to investors. They provide a common language for evaluating businesses, comparing performance across companies, and estimating intrinsic value. Without a common set of accounting standards, meaningful financial analysis would be nearly impossible.

Yet financial statements do more than record economic events. They measure them. Before an economic event becomes reported earnings, accounting standards and management judgment determine how that event will be reflected in the financial statements.

Most investors focus on headline numbers. Very few spend much time trying to understand how those numbers came to be. Yet in failing to do so, they can miss distinctions that materially affect how a business should be evaluated.

Two recent examples illustrate how and why.

Accounting Rules

Over the past two quarters, Alphabet reported billions of dollars of gains related to its investment in Anthropic, one of the world's leading artificial intelligence companies. Those gains represented more than half of Alphabet's reported earnings during each of the past two quarters. Amazon, whose investment in Anthropic is believed to be somewhat larger than Alphabet’s, likewise benefited from the company’s rapidly increasing private-market valuation. With Anthropic reportedly considering an initial public offering at a valuation approaching $2 trillion, the potential magnitude of these accounting effects could become considerably larger still. Furthermore, because both companies are among the largest constituents of the S&P 500 index, these accounting gains also represent a meaningful contribution to the reported earnings growth of the S&P 500 index itself.

Those are remarkable facts.

Without generating a single dollar of realized earnings, a private company's financing rounds materially influenced the reported earnings of two of the world's largest public companies while simultaneously affecting one of the most closely watched measures of corporate profitability in the world: the earnings of the S&P 500.

Most investors naturally focused on the headline numbers themselves. Few take the time to examine how and why these gains appear in reported earnings in the first place. The answer stems less from the economics of Anthropic than from the accounting rules governing how investments are reported.

To understand why, consider a simplified example.

Imagine two companies each invest approximately one-fifth of the equity of the same rapidly growing private business.

One acquires a 19.9% ownership interest.

The other acquires 20.1%.

Economically, the difference is almost meaningless. Each investor owns roughly one-fifth of the company. Each benefits if the business becomes more valuable. Each participates in substantially the same underlying economics.

Accounting, however, can treat those two investments very differently. Depending on the circumstances, the 19.9% investment may be reported under the fair value method, while the 20.1% investment may qualify for the equity method because ownership of approximately twenty percent generally creates a presumption that the investor exercises "significant influence" over the business. Under the fair value method, changes in its value flow directly into reported earnings. Under the equity method, the investor generally recognizes only its proportionate share of the investee's reported earnings or losses.

The implications of this accounting difference are striking. Suppose the underlying company in our hypothetical is still investing aggressively in future growth and reports little or no current profit. It may even be generating significant operating losses. Under the fair value method the 19.9% investor could recognize potentially substantial gains associated with any changes in the market value – public or private – of its investment. Under the equity method, the 20.1% investor would instead report only its share of the company's operating gains or losses. It wouldn’t record any of the unrealized gains or losses in market value on the investment.

The underlying investment is the same. The economics are virtually identical. Only the accounting treatment – and therefore the reported earnings – is different.

In the cases of both Alphabet and Amazon, had they owned 20% and been deemed to possess significant influence instead of the mid-teens ownership that they actually had, their reported earnings would have been more than 50% lower than actually reported. Nor would the impact have been confined to Alphabet and Amazon. It would have materially lowered the earnings of the entire S&P 500 due to their sheer size.

The purpose of this example wasn’t to teach the finer points of investment accounting. It was to illustrate a broader lesson. Before reacting to reported earnings, investors should try to understand the accounting rules that produce them. Sometimes the most important information isn’t found in the reported number itself, but in the accounting methodology used to determine it.

Management Judgment

Accounting rules, however, tell only part of the story.

Financial statements aren’t just shaped by accounting standards, they also depend on management's judgment. Along with their quarterly earnings report, Microsoft recently provided a useful illustration when management announced that they had decided to extend the estimated useful lives of certain data center assets from fifteen years to twenty-five years.

Nothing about the physical assets changed when Microsoft revised its estimate. The data centers didn’t suddenly become newer – the only thing that changed was the accounting estimate. By extending the estimated useful lives of those assets, Microsoft reduced the amount of depreciation expense that will be recognized each year going forward. Lower depreciation expense will increase reported earnings even though the underlying economics of the business remained largely unchanged.

Was Microsoft's estimate reasonable?

Maybe. Maybe not. The key issue is that no accounting standard can answer that question with certainty because it depends on the future. How long will these assets remain economically useful? No one knows. For now, the accounting reflects management’s judgment.

This issue also recently came up when investor Michael Burry (of The Big Short) publicly argued that certain artificial intelligence GPUs may become economically obsolete far more quickly than many companies are currently assuming. Whether his conclusion ultimately proves correct is almost beside the point. His comments simply illustrate that reasonable people can legitimately disagree about the economic lives of rapidly evolving technologies.

Accounting nevertheless requires management to choose a single estimate today. Those estimates directly influence reported earnings, even though their accuracy may not be known for many years.

Unlike accounting classification, which is largely governed by established rules, estimates require judgment. They reflect management's best assessment of an uncertain future based upon the information available at the time. As new information emerges, those estimates may change. When they do, reported earnings change along with them.

Reading Between the Lines

The two examples in this essay involve different accounting questions. The Anthropic example demonstrates how accounting rules can materially influence reported earnings. The Microsoft example demonstrates how management judgment can materially influence reported earnings. Together, they illustrate that understanding reported earnings often requires looking beyond the reported numbers to the accounting that produced them.

Neither example suggests that the accounting is flawed. Accounting standards are designed to provide investors with a consistent framework for measuring economic activity. Management estimates are unavoidable because financial reporting often requires judgments about events that will not be fully known for many years.

The lesson for investors is a different one. Reported earnings shouldn’t be viewed as the end of the analytical process. They are just the beginning. Understanding a business requires more than reading the income statement. It requires understanding the accounting policies, classifications, estimates, and judgments that produced the reported numbers. Often, the most important information is found not in the headline earnings figure, but in the notes that explain how those earnings were measured.

Financial statements remain among the most valuable tools available to investors. But to use them well, investors must learn to read between the lines.


Editor's Note

This essay is part of our ongoing Latticework series, which examines today's investment environment through the lenses of multiple disciplines. Previous essays explored behavioral finance, neuroscience, and microeconomics. This essay approaches the same broad questions through the lens of financial statement analysis, focusing on how major capital investment cycles are reflected in reported financial results over time.

Complex investment problems rarely yield to a single discipline. Our objective is not to replace one framework with another, but to build a broader latticework of mental models in which each discipline contributes insights that the others cannot.

The previous essay examined how extraordinary capital investment and increasing competition can reshape the economics of businesses and industries. This essay builds on that foundation by examining how those same capital investment cycles flow through financial statements over time. The next essay in this series will examine these same questions through the lens of credit analysis, exploring how the cost and availability of capital influence businesses, markets, and investment outcomes.

When Monopolies Converge

Competition and the Durability of Extraordinary Economics

By Kevin Tanner | Chairman | CEO | Chief Investment Officer

Most commentary on artificial intelligence is framed through a macroeconomic lens. Economists, strategists, and analysts debate productivity, labor markets, inflation, electricity demand, fiscal policy, and the broader implications for economic growth. These are important questions, and they understandably dominate headlines.

Yet as investors, we don't own the economy. We own businesses.

For investors, that distinction may prove critical. The long-term returns earned by shareholders aren't going to depend on how artificial intelligence transforms society, but on how it reshapes the economics of the companies now racing to commercialize it.

Charlie Munger once observed that "Microeconomics is what we do, and macroeconomics is what we put up with." His observation may prove especially relevant in the coming years given what’s at stake. The most important investment questions surrounding artificial intelligence revolve less around macroeconomics than microeconomics – not whether AI succeeds, but how it is changing industry structure, competitive dynamics, pricing power, and ultimately, who captures the value created.

The extraordinary scale of today's artificial intelligence boom has attracted enormous attention. Far less appreciated are the structural changes it is setting in motion.

Throughout history, some of the world's most profitable businesses have enjoyed exceptional profitability because competition was limited. Those advantages have arisen for many different reasons. Patents, regulation, network effects, scale, switching costs, and powerful brands have each allowed companies to earn returns well above their cost of capital for extended periods. While many of these businesses are often described as "monopolies," their defining characteristic isn’t necessarily the absence of competitors. It’s the presence of durable pricing power and economic advantages that are difficult to replicate. Warren Buffett has long described these durable competitive advantages as "economic moats."

Economists have long recognized that the profitability of an industry depends not simply on the quality of its products, but on the intensity of competition among the firms that produce them. Businesses operating behind strong barriers to entry often earn returns well above their cost of capital because competitors find it difficult to challenge their position. When competition is limited, firms often possess sufficient pricing power to charge prices well above the marginal cost of serving an additional customer. Sustained over time, that pricing power gives rise to the excess profitability associated with monopoly-like market structures. Those excess returns – or what economists refer to as economic rents – are not merely the reward for innovation. They are also a reflection of industry structure.

This distinction is important. Innovation creates value. Competition determines how that value is divided.

In practical terms, competition matters because it determines how many alternatives customers possess. As alternatives increase, demand becomes more elastic, pricing power weakens, and more of the value created by innovation is transferred from producers to consumers.

When competition is limited, producers typically capture a large share of the economic benefits through higher prices, stronger margins, and exceptional returns on invested capital. As competition intensifies, however, those benefits are dispersed. Prices decline. Customers gain bargaining power. Returns on capital gradually migrate toward more normal levels. Society may become better off even as shareholders receive a smaller portion of the value that innovation creates.

For investors, this distinction is critical because long-term investment success isn't dependent on identifying transformative technologies. It requires identifying businesses capable of sustaining exceptional returns on capital over long periods of time. It is entirely possible for a transformative technology to create enormous benefits for consumers while simultaneously producing less attractive economics for the companies commercializing it. Even if future profitability and growth prove somewhat less extraordinary than they might have been otherwise, outstanding businesses can still produce excellent long-term investment results so long as the underlying economics of the business continue to justify its valuation.

Competition does more than shape prices; it also shapes the flow of capital throughout an industry.

When industries generate extraordinary returns on invested capital, those returns attract investment. Existing firms expand. Companies operating in adjacent markets begin targeting the same opportunity. Suppliers increase production. Entrepreneurs search for new opportunities. Investors willingly finance ambitious new projects.

One of the central insights of microeconomics is that excess returns rarely persist indefinitely. Incremental investment gradually changes industry structure. New capacity expands supply. New entrants increase competition. Pricing power weakens. Returns on capital migrate toward more competitive levels. Ironically, the very profitability created by limited competition often becomes the force that ultimately erodes it.

The process can take years to unfold, but it has repeatedly reshaped industries that previously appeared nearly unassailable. Today, that possibility deserves particular attention because many of the world's most dominant technology companies are converging on overlapping opportunities. Artificial intelligence may ultimately reshape not only the technologies they develop, but also the competitive dynamics that have long sustained their extraordinary economics.

For much of the past two decades, many of the world's most profitable technology companies benefited from operating in largely separate markets characterized by monopoly-like economics. Search, social media, enterprise software, cloud infrastructure, e-commerce, premium consumer hardware, and advanced semiconductors each produced dominant businesses with extraordinary economics because their most profitable activities did not directly overlap. These companies were often grouped together as “Big Tech,” but economically they didn’t really compete with one another in their core businesses.

Increasingly, the same companies that once enjoyed dominant positions in separate markets are now converging on the same battlegrounds. Microsoft, Google, Amazon, Meta, OpenAI, Anthropic, Oracle, Nvidia, and others are all deploying enormous amounts of capital toward AI infrastructure, models, applications, distribution, and enterprise adoption. As a result, the boundaries between their businesses are beginning to blur.

Cloud companies are increasingly moving beyond their traditional role as infrastructure providers by developing their own AI models. Model developers are becoming enterprise software companies, while some are also exploring consumer hardware. Social media platforms are exploring commercial cloud infrastructure. Hardware suppliers are expanding into AI systems and networking. The competitive boundaries that once separated many of these firms are fading.

Each sees the opportunity as strategically essential. Each fears being left behind. Each still possesses the financial resources – or market access – needed to remain in the race. Together, they are now pursuing what must eventually become a much more contested prize.

This convergence has important microeconomic implications. The market often assumes artificial intelligence will simply extend the exceptional profitability of yesterday's dominant platforms. But the economics of monopoly are fundamentally different from the economics of other market structures. Extraordinary profitability depends not only on innovation, but also on limited competition. As more firms move into direct competition, customers are provided with alternatives, pricing power weakens, and the economic returns that once appeared unassailable eventually become more difficult to sustain. A company that dominates search, social networking, enterprise software, or cloud infrastructure can earn extraordinary returns so long as the competitive boundaries between those markets remain intact. The question is what happens when many of those territories begin to overlap.

This is fundamentally a question about market structure and competition. The largest technology companies are already beginning to compete more directly with one another. That competition may accelerate innovation and broaden adoption. It may also increase the total value artificial intelligence creates for society. Some firms may strengthen existing competitive advantages as artificial intelligence becomes more deeply embedded throughout their ecosystems, increasing switching costs and reinforcing customer relationships. Others may find those same advantages weakened by standardized capabilities and open models. Whether artificial intelligence ultimately reinforces or erodes those economic moats may prove far more important than many investors currently appreciate.

Competition often transfers value from producers to consumers. Better products, lower prices, and faster innovation may represent extraordinary progress for society while simultaneously rendering exceptional returns on invested capital more difficult to sustain. The interests of consumers and producers aren’t always aligned.

These competitive dynamics aren’t theoretical. The price of accessing artificial intelligence is already falling at an extraordinary rate. As models improve, computing becomes more efficient, and competition expands, users are gaining access to increasingly capable systems at a fraction of their previous cost. For consumers, this is overwhelmingly positive. Lower prices accelerate adoption, expand the range of economically viable applications, and increase the total value the technology creates for society. From the perspective of producers, however, rapidly falling prices raise a different question: who ultimately captures those gains?

The implications extend well beyond lower prices. Artificial intelligence appears to be following a familiar pattern observed throughout economic history: the value created by a breakthrough technology continues to grow even as competition steadily reduces the price of accessing it. Those two developments are often confused. The first expands the technology's importance to society. The second determines how much of that value producers are ultimately able to retain.

Whether those gains ultimately accrue to producers, consumers, or both depends less on the technology than on competitive structure. Artificial intelligence is redrawing the competitive boundaries that have long separated many of the world's most profitable technology businesses. Companies that once dominated largely separate economic territories are increasingly making many of the same strategic investments – building data centers, developing AI models, expanding cloud infrastructure, and integrating artificial intelligence into virtually every product they offer.

Historically, many of these businesses enjoyed an unusually attractive combination of durable competitive advantages and relatively modest incremental capital requirements. Maintaining their competitive positions often required far less investment than building them in the first place. That combination helped produce the extraordinary returns on invested capital that investors came to associate with the largest technology platforms.

Convergence may begin to change that equation. As formerly distinct monopolies increasingly compete for the same opportunities, companies may find themselves committing growing amounts of incremental capital not merely to pursue new markets, but simply to defend the competitive positions they already possess. Offensive investments by one firm increasingly become defensive necessities for another. The critical question for shareholders therefore isn't just how much the addressable market expands, but how much additional capital must be committed merely to preserve the current competitive position of the business.

If that required reinvestment rises materially, the implications extend well beyond individual products or competitive moats. Even if dominant firms retain their leadership positions, the economics available to shareholders may change because maintaining those positions has become more expensive. The issue is not whether the businesses remain exceptional. It is whether exceptional businesses begin requiring substantially greater incremental capital simply to remain exceptional.

Each company may therefore be acting rationally in pursuit of its own strategic objectives, even as those decisions – in aggregate – reshape the competitive environment in ways that ultimately may render extraordinary returns more difficult to sustain.

These competitive dynamics are compounded by the extraordinary capital intensity of artificial intelligence. Based on reported 2025 capital expenditures and management guidance for 2026, the largest technology companies are expected to collectively invest well over a trillion dollars across the two-year period in data centers, advanced semiconductors, networking infrastructure, and AI models.

The same companies now competing for overlapping profit pools are driving one of the largest capital investment cycles in business history. If those investments continue expanding capacity and intensifying competition, they may eventually erode the economic foundations underlying their historically exceptional returns.

Industries characterized by high fixed costs often compete differently from those requiring relatively little capital. Once billions of dollars have been invested in factories, railroads, fiber-optic networks, semiconductor fabrication plants, or data centers, the central economic question gradually shifts. The challenge is no longer simply whether the infrastructure should be built. It becomes how profitably that infrastructure can be utilized.

Idle assets generate no return, and partially utilized assets often fail to earn adequate returns on the capital invested to build them. Once enormous fixed investments have been made, management's incentives begin to change. Recovering fixed costs often becomes more important than maximizing the margin on any individual transaction.

These economic dynamics help explain why businesses requiring continual reinvestment of enormous amounts of capital have historically found it more difficult to sustain exceptional returns on invested capital than businesses requiring comparatively little additional investment.

This dynamic has shaped many of history's most capital-intensive industries. Airlines discount seats that would otherwise depart empty. Hotels lower room rates during periods of weak demand. Fiber-optic networks that once promised extraordinary economics eventually competed aggressively for traffic across infrastructure that had already been built. In each case, pricing strategies increasingly reflected the imperative to maximize capacity utilization rather than preserve pricing power.

Artificial intelligence may eventually produce similar competitive dynamics. At that point, the emphasis will shift from building additional capacity to earning an acceptable return on existing capacity.

Convergence is already emerging throughout the technology stack:

Microsoft is integrating AI models throughout its enterprise software franchise, bringing it into more direct competition with OpenAI, Google, and Anthropic for enterprise AI adoption.

Google is embedding Gemini across Search, Cloud, and Workspace, further blurring the historical boundaries between search, enterprise software, and cloud computing.

Amazon is extending beyond its traditional role as a cloud infrastructure provider into AI models and proprietary silicon, bringing it into more direct competition with companies that were once its customers and partners.

Meta is extending beyond its advertising-driven social platforms into AI models, developer tools, and custom silicon, bringing it into more direct competition with model developers and semiconductor companies.

OpenAI is no longer simply a foundation model developer. It is expanding into enterprise software and consumer hardware, increasingly competing with companies that were once customers, partners, distributors, and investors.

Oracle, once viewed primarily as an enterprise database company, has emerged as a major provider of AI infrastructure, competing for workloads once expected to remain concentrated among the hyperscale cloud providers.

Nvidia increasingly competes not only with traditional semiconductor companies but also across networking, systems, software, and cloud services, while many of its largest customers simultaneously develop proprietary AI accelerator chips of their own. Amazon, Microsoft, Google, and Meta remain among Nvidia's largest customers, yet each is investing heavily in custom silicon, at least in part to reduce dependence on Nvidia.

Although these companies continue to possess significant competitive advantages, their future growth increasingly depends on succeeding in markets where many of their strongest rivals are pursuing the same opportunities. From a microeconomic perspective, this distinction is important. Extraordinary returns are much easier to sustain when firms compete in separate markets. It becomes much more difficult when those same firms increasingly compete for the same customers.

Taken together, these developments suggest that the competitive dynamics described throughout this essay are already well underway. How long this process will take to unfold, and even whether it ultimately results in excess capacity, remains uncertain. Demand for artificial intelligence may continue expanding for many years, and today's enormous investments may prove entirely justified. Whether today's extraordinary economics prove durable will depend on how industry structure evolves from here.

History and economic theory both suggest that investors should be wary of becoming overly confident that today's extraordinary economics will persist indefinitely. Capital markets perform one of society's most valuable functions by directing financial resources toward attractive opportunities. Yet in doing so, they also possess an inherent tendency to finance away the very scarcity that often made those opportunities exceptionally profitable in the first place. Exceptional returns attract capital. Capital creates capacity. Capacity intensifies competition. Over time, competition often transfers an increasing share of the value created by innovation from producers to consumers. In doing so, it can render extraordinary profitability increasingly difficult to sustain.

Recent developments in artificial intelligence already offer an early illustration of these dynamics. Even as the technology continues to improve at a remarkable pace, the cost of accessing increasingly capable models has fallen dramatically as competition has intensified and efficiency has improved.

For investors, these dynamics deserve careful consideration. Today's market has become extraordinarily concentrated in companies whose valuations implicitly assume that historically exceptional profitability will persist. Artificial intelligence may become one of the most valuable technologies ever developed, transforming industries, improving productivity, and creating enormous benefits throughout the global economy. Transformative technologies often change the world. They also change the industries that commercialize them.

Charlie Munger reminded us that investors own businesses, not economies. The central investment question is not whether artificial intelligence creates economic value, but whether it strengthens or weakens the durable competitive advantages that determine who ultimately captures that value.


Editor's Note

This essay is part of our ongoing Latticework series, which examines today's investment environment through the lens of multiple disciplines. Previous essays explored the same broad questions through the lenses of behavioral finance and neuroscience. This essay approaches those questions through the lens of microeconomics, focusing on how competition and market structure shape who ultimately captures the value created by innovation.

Complex investment problems rarely yield to a single discipline. Our objective is not to replace one framework with another, but to build a broader latticework of mental models in which each discipline contributes insights that the others simply can’t.

The next essay in this series will examine these same questions through the lens of financial statement analysis, focusing on how accounting determines when economic benefits and costs become visible to investors.

The Neuroscience of the Sirens' Song

Homer was clearly on to something. Modern neuroscience suggests that physiological mechanisms in our brains help explain many of the behaviors documented by behavioral finance.

One intriguing finding is that our brains don’t process anticipated gains and losses symmetrically. When we imagine future rewards, a subcortical region known as the nucleus accumbens becomes active. This region is rich in dopamine and is associated with reward, motivation, and reinforcement. The anticipation of gains activates this system, generating a physiological signal that can amplify optimism before any gains are actually realized. This suggests that the anticipation of future rewards can become reinforcing in its own right – a dynamic that may help explain why speculative booms often become emotionally intoxicating. Notably, this is the same reward circuitry that has been implicated in gambling addiction.

Anticipated losses, however, tend to be processed through completely different neural systems, including regions such as the amygdala and insula, which are more closely associated with threat detection, aversion, fear, and bodily discomfort. In this sense, our brains simply don’t respond to the prospect of losses the same way we do to gains.

That asymmetry may help explain a familiar feature of financial markets: investors often worry the least about risk after markets have risen substantially and become much more risk averse after markets have already fallen. During prolonged advances, rising prices do more than increase wealth; they reinforce confidence and the expectation of future returns. As investors imagine future gains, dopamine-mediated reward systems are repeatedly activated. Risk doesn’t disappear, but it becomes much easier to ignore. The psychological weight assigned to potential rewards begins to exceed the weight assigned to potential risks. Existing risks can remain right in front of us, but they become much easier to discount, rationalize, or overlook.

When markets finally do reverse, the process often flips in the opposite direction. As anticipated gains fade, so too does the neurological reinforcement associated with reward circuitry. Risks that were present all along suddenly come into sharper focus. Investors often experience this as a new realization, but the underlying risks usually haven’t changed anywhere near as much as perceptions have. The rocks never moved. The Sirens' song simply made them easier to overlook.

This observation may initially appear inconsistent with one of the most influential findings in behavioral finance. Daniel Kahneman and Amos Tversky famously demonstrated that people tend to experience losses more intensely than equivalent gains. Losing one hundred dollars generally hurts more than gaining one hundred dollars feels good. This principle, known as loss aversion, became a cornerstone of Prospect Theory and helped explain a wide range of investor behavior.

Yet the two ideas are not at all contradictory. They’re simply describing different stages of the decision-making process.

The neuroscience of reward anticipation helps explain why investors become captivated by the potential for gains before outcomes are known. Prospect Theory helps explain what happens after gains and losses begin to feel real. One helps explain why investors steer toward the Sirens. The other helps explain what happens when the rocks suddenly come into view.

Prospect Theory contains another important insight that helps explain investor behavior during market declines. The pain associated with realizing a loss can become so psychologically powerful that many investors prefer a gamble offering the possibility of recovery over accepting a certain loss. Decision-making shifts away from discipline and toward recovery. Rather than accept a loss, investors frequently choose to take on additional risk in the hope of getting back to even. This helps explain why declining markets often provoke not caution but escalation – averaging down, increasing exposure, or doubling down on positions that are already under water. At some point, however, as losses deepen and the prospect of recovery begins to feel increasingly hopeless, this risk-seeking behavior can give way abruptly to capitulation, with investors shifting almost instantly from trying to get back to even to simply preserving what they have left.

During speculative advances, anticipated gains activate reward systems that focus attention on opportunity and reinforce optimism. As prices rise, investors increasingly imagine future rewards, and those imagined rewards themselves become psychologically persuasive. Risks remain present, but they carry less weight. The Sirens' song grows louder.

When markets reverse, the same investors often undergo a dramatic shift in perception. The anticipated rewards that once dominated attention recede while potential losses become harder to ignore. Loss aversion begins to exert greater influence. Investors become more sensitive to downside risk, more focused on preservation, and less willing to take on uncertainty. In many cases, they become most risk averse only after prices have already fallen substantially.

This helps explain one of the enduring paradoxes of financial markets. Investors often become least concerned about risk when risk is greatest and most concerned about risk after the bulk of the damage has already been done. The underlying fundamentals generally change far less than sentiment, attention, and perception.

Seen through this lens, speculative cycles are not simply stories about greed and fear. They are stories about how humans process opportunity and danger. Speculative cycles reflect the interaction of distinct neurological and psychological mechanisms. Reward-seeking systems encourage investors to focus on opportunity during booms, while loss aversion and threat-detection systems become increasingly dominant during busts.

This is also where value investing and contrarianism enter the discussion. The discipline required to buy when markets are plummeting, or to resist what others have been chasing, runs directly against the emotional currents created by markets themselves. Warren Buffett captured the idea perfectly: "Be fearful when others are greedy and be greedy when others are fearful." The difficulty is that this advice sounds simple only in hindsight. In real time, greed often arrives wrapped in confidence, consensus, and recent gains, while fear arrives wrapped in falling prices, uncertainty, and the sudden recognition of risks that were present all along. Successful value investing is less about superior intelligence than about resisting the powerful neurological and emotional forces that drive the crowd – and that challenge is much less analytical than it is emotional.

Homer understood the practical implication thousands of years before neuroscience existed. Odysseus couldn’t assume he would remain rational once the Sirens started singing. He knew that temptation itself would impair his judgment. His solution wasn’t intelligence, courage, or willpower. It was preparation. He bound himself to the mast before the music began.

Investors have always faced similar challenges. The greatest dangers in markets rarely arise because risks are invisible. More often, they arise because compelling narratives make those risks easier to ignore. The rocks are always there. The challenge is remembering that fact when the Sirens are singing loudest.

The Song Remains the Same

When Sirens Sing: How Market Cycles Seduce Investors

By Kevin Tanner | Chairman | CEO | Chief Investment Officer

Let’s face it, there are stretches when markets can make caution feel irrational. Common sense falls by the wayside and, with each new market advance, restraint comes to be viewed less as discipline than missed opportunity. “As long as the music is playing,” former Citigroup CEO Chuck Prince famously said near the peak of the pre-2008 credit boom, “you’ve got to get up and dance.”

The dancer in question, Chuck Prince, resigned just months later in 2007 as the unfolding subprime crisis revealed Citigroup to be far more fragile than markets believed. A year later, the firm required tens of billions in federal support to survive. Prince’s words endured because they captured something deeper than greed.

During speculative cycles, the pressure to participate becomes psychologically overwhelming – even to a top banker who, one would think, knows better – precisely because parts of the story are true. Rising stock prices create social confirmation. Consensus itself becomes emotionally persuasive. The longer trends persist, the more investors mistake momentum for inevitability and price appreciation as evidence that their underlying assumptions are correct.

Each Siren’s song has fresh lyrics, but they all conform to a pattern Homer described in The Odyssey, an epic in Greek literature written more than 2,500 years ago.

In Homer’s Odyssey, the Sirens were not predators in the ordinary sense. They did not attack ships or overpower sailors by force. Instead, they waited patiently on a rocky island surrounded by the wreckage of those who came before and sang seductive songs. Ancient descriptions vary, but the essential idea remains the same: the Sirens overwhelmed judgment through persuasion. They promised knowledge, revelation, insight. They sang directly to what each sailor most wanted to believe about himself, convincing him that he was sophisticated enough to approach safely and exceptional enough to understand what others could not.

That’s what made them deadly.

The sailors steered themselves directly into the rocks, rendered unable to exercise judgment. Odysseus understood this before he ever approached. He recognized that the real danger wasn’t ignorance, but exposure. Once the music started, he knew he would no longer be able to trust his own judgment. So he prepared in advance, establishing his own precommitments: wax in his crew’s ears, rope lashing himself to the mast, strict instructions that no matter how violently he begged to be released, they must ignore him.

Every frothy market has its own Sirens.

Today they sing about artificial intelligence, momentum, technological inevitability, and the promise that innovation will overcome every structural constraint confronting the global economy. Their song is seductive because the underlying story contains elements of truth. AI is transformational. It may eventually raise productivity, reshape – even disrupt – industries, and create extraordinary long-term economic value for society.

That said, history reveals that the most dangerous market manias are never built on fiction alone. Every prior technological step-change in modern history has left behind its own coastline of bleached bones. Railroads transformed America. Electrification transformed industry. The internet restructured modern civilization. Yet each also produced waves of overinvestment, speculation, leverage, and enormous losses for investors. The lesson: technology usually succeeds. Most investors don’t.

The pattern is not theoretical. Cisco was one of the defining companies of the internet era, and its business ultimately validated much of the optimism embedded within it. Yet investors who purchased the stock at the peak in 2000 waited more than twenty-five years to get back to even in nominal terms – and they’re still waiting if you take inflation into consideration. Likewise, Amazon went on to become one of the most dominant companies in history but still declined more than 90% during the unwind of the same cycle before compounding extraordinary returns from a much lower base. Others, like Enron, were not mispriced versions of real success but outright illusions where narrative, complexity, and momentum completely obscured the underlying lack of substance.

Different outcomes, but a common thread: in episodes where narrative and momentum dominate market pricing, technological progress, intrinsic value, and investor returns can diverge dramatically. These distinctions matter now because markets are already well past being merely optimistic.

The preceding era was defined by secular disinflation, globalization, cheap energy, favorable demographics, falling interest rates, declining term premiums, and a steadily declining cost of capital.

In the aftermath of the Global Financial Crisis, those forces were amplified by zero-interest-rate policies, quantitative easing, abundant liquidity, and repeated central-bank intervention. Together, they created an ideal environment for long-duration growth assets, venture capital, leveraged finance, passive concentration, and buy-the-dip psychology to flourish.

But the regime that produced those conditions no longer exists.

Since the pandemic, inflation has structurally shifted upward. Long-term interest rates broke out of a forty-year downtrend five years ago. Fiscal discipline has steadily deteriorated across much of the developed world. Geopolitical fragmentation has also intensified. Supply shocks are recurring faster than previous dislocations can be fully rectified. The cost of capital is rising, and the tide that once swept everything in a froth of cheap money has long since turned. Yet current market pricing remains anchored to assumptions formed under a very different set of economic conditions.

The great vulnerability today is not merely that stocks are expensive. It is that large parts of the financial system remain priced for an interest rate environment that no longer appears consistent with the more inflationary world around us today. Asset prices, private market marks, refinancing assumptions, and investor behavior all remain dependent on the belief that inflation will fade back toward its old range, that rates will eventually revert downward, that liquidity will remain abundant, and that technological progress will overwhelm all constraints.

AI enthusiasm increasingly appears to be sustaining assumptions inherited from that earlier environment. That is today’s Sirens’ song. AI seems to offer investors a seductive answer to every structural problem. Productivity will offset inflation. Automation will solve labor shortages. Growth will outrun deficits. Scale will justify valuation. Technology will protect margins. Innovation will render old rules obsolete.

Some of that may ultimately prove true. But in the meantime, investors appear to be pricing a collection of plausible outcomes as though they were inevitable.

When bubbles form around transformative technologies, they rarely emerge from pure fiction. As OpenAI cofounder Sam Altman himself observed, speculative manias often begin with “a kernel of truth” powerful enough to justify genuine optimism before eventually encouraging extraordinary excess.

AI is anything but asset-light. Already, the buildout represents one of the largest capital expenditure cycles in modern American history. Datacenters require enormous amounts of electricity as well as vast quantities of land, water, chips, cooling systems, transmission infrastructure, financing, and time. They compete for capital in a world already strained by deficits, rearmament, reshoring, energy transition, and demographic pressure. Our digital future is increasingly constrained by physical bottlenecks.

Large infrastructure projects have a long history of requiring more time and money than initially projected. Permitting delays, labor shortages, rising input costs, financing constraints, and political opposition have repeatedly challenged the economics of major buildouts. History offers little precedent to assume today’s AI buildout will prove uniquely immune to these realities.

Altman himself has openly acknowledged both the scale and speculative nature of what is unfolding. In discussing AI infrastructure financing, he suggested that the world may need “a new kind of financial instrument” to fund the enormous “compute” buildout ahead. Elsewhere, when asked whether investors had become overexcited about AI, he compared the current environment to the dot-com bubble and observed that “somebody is going to lose a phenomenal amount of money.” The warning was striking precisely because it echoed the history of prior transformative technological booms: enormous societal benefit often accompanied by substantial capital destruction for investors.

Consider the Stratos project underway in Box Elder County, Utah. Stratos is projected to occupy a 40,000-acre campus – more than twice the size of Manhattan – while operating an integrated compute-and-power system utilizing roughly nine gigawatts of electricity. For perspective, that’s roughly 4.5 times the output of Diablo Canyon, California’s last operational nuclear plant, which generates about 9% of the state’s electricity. Nor is Stratos the largest such project currently under development. It is merely one visible example of a global infrastructure race whose scale would have seemed unimaginable only a few years ago.

Today’s AI boom looks much less like traditional software cycles than it does the railroad, electrification, and fiber-optic buildouts that transformed earlier generations. This discussion isn’t merely macro. There are important micro ramifications as well.

Investors should recognize that many of the Magnificent Seven have spent years enjoying the economic benefits associated with dominant or near-monopoly positions in largely separate markets. Search, social media, enterprise software, cloud computing, e-commerce, premium consumer hardware, and advanced semiconductors each generated extraordinary returns with relatively limited direct competition from one another. Increasingly, however, many of these same firms are now converging on the same AI opportunity, deploying enormous amounts of capital in pursuit of what must ultimately be a contested prize. As this trend continues, investors may find it increasingly difficult to justify extrapolating the economics of yesterday's monopolies into a future that looks considerably more competitive.

This convergence is not incidental. These kinds of generational capital expenditure booms consume enormous amounts of both capital and physical resources and are inherently inflationary. They invite overcapacity, require financing, and are vulnerable to rising interest rates. Buildouts like we’re seeing now tend to end up rewarding society far more than the investors who finance them in aggregate – especially those who show up late to the dance.

Historically, these are the kinds of conditions in which momentum has proven especially dangerous.

Since the pandemic trough, and especially following the public release of ChatGPT, markets have increasingly become momentum-driven. Leadership has narrowed aggressively into a concentrated group of perceived AI beneficiaries, with the Magnificent Seven now accounting for roughly a third of the S&P 500's total market capitalization. If Alphabet, Amazon, Meta, and Tesla were classified as technology companies, the broader technology sector would represent more than half of the index's market value.

Passive capitalization weighting has mechanically directed larger flows toward the same winners as their market capitalizations expanded. Relative performance pressures have encouraged active managers to chase the same leadership rather than risk underperforming increasingly concentrated benchmarks.

These dynamics may be more powerful today than during previous speculative episodes. Passive mandates now represent a far larger share of equity ownership than they did during the late-1990s technology bubble, increasing the importance of benchmark-driven flows and concentration effects.

This is how we arrive at environments where a handful of companies increasingly dominate benchmarks, passive flows reinforce concentration, and owning the same leadership names becomes increasingly difficult for many investors to ignore. It is classic herding.

Retail speculation has further amplified these dynamics over recent years. Options activity, thematic trading, and social reinforcement loops have accelerated the tendency for rising prices themselves to become interpreted as confirmation of the underlying bullish narrative. In many cases, valuations at the individual company level have expanded far more rapidly than their capacity to generate cash flow, suggesting that narrative reinforcement, behavioral extrapolation, and momentum themselves have become primary drivers of market pricing.

Markets are especially vulnerable to these dynamics because many of the biases governing human decision making become most powerful after prolonged advances. Investors naturally extrapolate recent experience into the future. Consensus becomes psychologically reassuring. Career risk discourages deviation from prevailing narratives while repeated reinforcement gradually erodes skepticism. Over time, investors do not merely begin expecting higher prices; they begin treating the continuation of the trend itself as evidence that their underlying assumptions must be correct.

Momentum works when price trends become self-reinforcing. Rising prices attract attention. Attention attracts investment flows. New investment reinforces the winners. The winners dominate market cap-weighted indexes. Passive flows send even more money their way. Backward-looking performance is perceived as evidence. Evidence then becomes narrative. Narrative becomes consensus.

A related phenomenon occurs when market prices begin influencing the behavior of investors, companies, lenders, and consumers, temporarily shaping the very fundamentals they are supposed to measure. Under certain conditions, prices become more than outputs. They become inputs into the feedback loop. Recent private funding rounds illustrate the point. Rising private valuations at Anthropic generated mark-to-market gains for both Alphabet and Amazon through their minority ownership stakes, significantly boosting reported earnings despite no corresponding change in operating performance and no realization of cash flows. In situations like these, market prices can begin influencing the very fundamentals investors are using to evaluate them.

In influential research on momentum investing, behavioral finance scholars Mark Grinblatt and Tobias Moskowitz found that investors often adapt slowly to major structural changes in the economic environment, allowing mispricing and market trends to persist longer than traditional financial theory would predict. Investors tend to underreact to regime shifts, especially when new realities conflict with entrenched narratives and existing consensus. The persistence of post-GFC assumptions in today’s market may be an example of that dynamic.

These pressures don’t just operate at the individual psychology level. They become embedded institutionally. Professional managers are rarely rewarded for diverging too early from consensus, but they are often punished for underperforming it. Over time, momentum stops being merely a behavioral phenomenon and becomes endogenous to the system itself.

Eventually, investors stop asking, “What is this worth and how is it going to compound from these levels?” and start asking, “How can I afford not to own it?”

That transition is psychological, not analytical.

Grinblatt and Moskowitz also documented how the very forces driving momentum can sow the seeds of reversal when expectations outrun economic reality. Technological revolutions often validate the underlying innovation while simultaneously destroying capital for investors who financed the boom at inflated prices.

Stanley Druckenmiller once described selling technology stocks near the peak of the dot-com bubble because valuations had become absurd, only to watch them continue rising. He understood the danger. He knew better. Yet he eventually bought them back near the peak anyway. “I just had to play,” he later admitted. “I couldn’t help myself.” Decades earlier, Yale economist Irving Fisher described the stock market as having reached a “permanently high plateau” just days before the end of the great momentum-driven rally that preceded the stock market crash of 1929.

These are just a few examples of the Sirens’ song at work.

They don’t make intelligent people stupid, but they can make discipline feel irrational.

The core assumption markets refuse to abandon is that the post-2008 framework remains the relevant one. It’s not. As I wrote about last quarter, the Five Ds – deficits, demographics, deglobalization, defense spending, and datacenter capital expenditures – are already firmly entrenched and placing upward secular pressure on inflation and longer-term interest rates. Massive fiscal irresponsibility amplifies all of them. Recurring supply shocks are not the cause of the new economic order; they merely act as catalysts and accelerators within it.

That distinction is important – temporary shocks fade; structural forces don’t.

This leaves markets in a precarious position. They remain priced for a world of lower rates, expanded multiples, and abundant liquidity while the real world is increasingly defined by rising capital costs, increasing fiscal strain, geopolitical fragmentation, energy constraints, and structurally persistent inflationary pressure.

These mismatches can coexist for some time. Markets have always shown the ability to remain expensive longer than skeptics expect, especially when powerful technological narratives become intertwined with momentum and institutional reinforcement. AI enthusiasm likely still has plenty of runway left. Capital continues to flow toward perceived winners, rising prices continue to validate consensus, and strong performance continues attracting additional inflows. Momentum tends to persist right up to the point that it doesn’t.

Warren Buffett once quoted the late Barton Biggs as saying, "A bull market is like sex. It feels best just before it ends." Colorful as the observation may be, it captures something important about speculative cycles. They’re often most seductive just before reality begins to set in.

Historically, this is how momentum-driven markets tend to end. They rarely collapse because investors suddenly lose faith in any underlying technology. More often, financing conditions tighten, expectations outrun economic reality, or leadership becomes so concentrated that even modest disappointments begin forcing investors to reassess previous assumptions. Some cycles unwind violently as reflexive flows suddenly reverse direction. Others simply spend years going nowhere while fundamentals slowly catch up to valuations. Occasionally, enthusiasm diffuses more gradually across the market. But regardless of the path, the same momentum dynamics that once amplified the advance eventually stop functioning as an accelerant.

The bottom line is that the longer faulty assumptions remain embedded in pricing, and the further reality diverges from perception, the more fragile the financial system becomes.

Odysseus survived the Sirens not because he was immune to their songs, but because he understood he would not be immune when the time came. He did not rely on willpower. He had himself bound to the mast before he heard the music.

That is what investment discipline is supposed to do.

Quality investing isn’t a short-term trading scheme. Valuation discipline doesn’t imply timidity. Strong balance sheets, durable cash flows, reasonable prices, and margins of safety are all important precommitments designed to protect investors precisely during the moments when judgment becomes most difficult. The closing lines of the Sirens’ song are always the most enchanting.

They’re in full chorus now.

The Sirens’ song is seductive precisely because it is rooted in something real. But never forget: the rocks are just as dangerous whether the songs ring true or not.

Latticework Series Introduction

The letter below as well as the two essays that follow have been extracted from our 2026 Q2 Report.

Every market cycle develops its own logic.

During prolonged bull markets, investors gradually come to view prevailing conditions as normal and permanent. Assumptions that may have begun as observations evolve into articles of faith. Valuations once considered aggressive come to be seen as reasonable or ignored altogether. Risks that once demanded careful scrutiny are increasingly dismissed. The longer a particular environment persists, the easier it becomes to believe it will persist indefinitely.

History tells us it won’t.

Financial markets are shaped by regimes. Interest rates rise and fall. Business cycles swing from boom to bust. Technologies emerge, mature, and – believe it or not – sometimes even disappoint. Competitive advantages strengthen and weaken. Yet investor perception and behavior often adapt far more slowly than the environment itself. Obsolete assumptions have driven some of history’s most consequential busts.

Several examples of this phenomenon were on display during the second quarter of 2026. Artificial intelligence remained the dominant investment narrative. The surge in capital expenditures tied to AI infrastructure accelerated. Equity valuations remained extreme despite persistent fiscal concerns, heightened geopolitical uncertainty, and the lingering economic repercussions from the conflict with Iran, including its effects on global supply chains. At the same time, questions about the long-term economics underlying today’s AI buildout continued to grow. Nevertheless, investors remained remarkably willing to look beyond these near-term uncertainties and focus instead on a distant and highly uncertain future.

Coming into the second quarter, the forces that had been shaping markets since the emergence of ChatGPT reached a new level of intensity. By April and May, momentum itself had become one of the market's defining characteristics, reinforcing an increasingly narrow leadership driven by the AI buildout. Strong returns attracted additional capital, which in turn fueled further gains, encouraging even more crowding into a remarkably narrow group of companies perceived to be the primary beneficiaries of the AI investment boom. Momentum strategies delivered record relative outperformance, market leadership became increasingly concentrated, and skepticism became increasingly difficult to sustain as each new advance appeared to validate the prevailing narrative.

One of the more revealing developments of the quarter was not simply the continued strength of equity markets, but the extraordinary volume of new capital being raised. SpaceX completed the largest initial public offering in history before returning less than two weeks later for an additional $25 billion in debt financing. OpenAI and Anthropic filed for public offerings at valuations expected to exceed $1 trillion each. Alphabet raised approximately $85 billion through a secondary offering. At the same time, corporations including Amazon, Oracle, Meta, and others continued tapping debt and equity markets to finance the enormous infrastructure investments required to support artificial intelligence. Together, these transactions are emblematic of one of the largest capital-raising waves in modern market history.

These developments raise an obvious question. Many of these companies have existed for years, and in some cases decades. Most have enjoyed ample access to private capital. Several possess balance sheets that leave little doubt about their ability to finance future growth. Why, then, is so much stock suddenly appearing for sale?

While IPO activity by itself isn’t a reliable timing indicator, major market peaks have frequently been accompanied by a surge in new issuance as founders, venture capitalists, and corporate insiders seek to capitalize on favorable market conditions. There are plenty of reasons to sell stock. Thinking that prices will rise much further is generally not one of them. These dynamics tend to emerge late in market cycles.

The same conditions that encourage investors to buy frequently encourage insiders to sell. Throughout history, periods of extraordinary optimism have often been accompanied by surges in equity issuance, debt issuance, and other forms of capital raising. Railroads, radio networks, telecommunications infrastructure, internet companies, and housing developments all required enormous amounts of financing. The willingness of investors to supply that financing – through equity, credit, and an expanding array of financing structures – has frequently transformed promising innovations into speculative booms. All of which, I might add, were followed by busts.

None of this diminishes artificial intelligence’s transformative potential. History's greatest technological revolutions were always legitimate. Railroads reshaped transportation, electrification transformed industry, and the internet revolutionized communication and commerce. Speculation doesn’t diminish the significance of the underlying technology.

Investors have never struggled to identify important innovations. The challenge they seem to run into time and time again has been distinguishing between technological promise and investment reality. Financial history repeatedly demonstrates that revolutionary technologies often coexist with speculative excess. The most dangerous periods tend to emerge not when innovation is absent, but when enthusiasm and hype become so widespread that skepticism itself falls by the wayside.

The quarter's closing weeks also illustrated how quickly market psychology can shift. SpaceX's record-setting initial public offering may ultimately come to be remembered as the symbolic crescendo of the AI-driven momentum trade. Investors initially rushed into the largest IPO in history, driving the shares more than 50% above the offering price within days and briefly propelling the company to one of the world's largest market capitalizations. Yet almost as quickly as the enthusiasm emerged, it faded. As investors began reassessing valuations, financing requirements, and execution risk, the stock surrendered virtually all of those gains.

The change was subtle but meaningful. By late June, some of the year's strongest momentum stocks were coming under pressure, while capital was beginning to flow toward higher-quality and more attractively valued businesses that had largely been overlooked throughout the AI-led advance. Whether this ultimately proves to be the beginning of a more durable change in leadership or just another brief rotation remains to be seen. What it does illustrate, however, is how quickly investor preferences can change once a dominant market narrative comes under scrutiny.

The common thread running through many of today’s market dynamics is not simply valuation, artificial intelligence, or interest rates. It is the increasingly powerful interaction between narrative, momentum, and human behavior. Markets are shaped not just by economic fundamentals, but also by the stories investors tell themselves about the future and the psychological forces that influence how those stories are processed.

The two essays that follow examine the current environment through the lenses of behavioral finance and neuroscience. Together, they explore why speculative cycles become so psychologically compelling and why intelligent investors repeatedly find themselves lured into them when prudence should matter most.

They also mark the beginning of a short series of essays that I'll be publishing over the next couple of months. Inspired by the late Charlie Munger's concept of a latticework of mental models, each essay will examine many of the same market developments through a different analytical discipline. Most market commentary – including much of our own – naturally emphasizes a macroeconomic perspective. Inflation, interest rates, fiscal policy, geopolitics, and economic growth will always matter enormously.

Yet no single discipline fully explains financial markets. My objective is not to replace the macro perspective, but to complement it by exploring how behavioral finance, neuroscience, microeconomics, financial statement analysis, and financial theory each illuminate different aspects of the same underlying phenomena. As always, I'll also try to place today's events within their broader historical context, because understanding where we are often begins with understanding where we've been. My hope is that, taken together, they provide a more complete understanding of the financial world around us.