
Financial Statement Analysis and the Two Clocks of Capital
By Kevin Tanner | Chairman | CEO | Chief Investment Officer
Every great capital investment boom is exciting while it lasts.
Prosperity is seemingly everywhere. New factories are built, workers get jobs, suppliers receive orders. Revenues rise and earnings surge. Whole industries suddenly flourish. The resulting optimism feels entirely justified because, at least initially, nearly everyone connected to the capital spending boom seems to benefit. History suggests that every major capital investment cycle follows this same pattern – one that has repeated across industries and generations.
Today's artificial intelligence (AI) buildout provides a particularly striking contemporary example. Semiconductor manufacturers are reporting record revenues. Memory producers are enjoying extraordinary pricing power. Companies that make servers, networking equipment, electrical infrastructure, cooling systems, transformers, and power generation equipment are struggling to keep up with demand. Engineering firms are designing massive data center campuses while construction companies are racing to build them. Utilities are committing billions of dollars to expand generating capacity, while developers are searching for suitable sites around the world. Quarter after quarter, businesses supplying the AI ecosystem have continued to report results that exceed expectations.
The impact extends well beyond the companies directly supplying AI infrastructure. Harvard economist Jason Furman estimated that data center construction accounted for approximately 92% of U.S. GDP growth during the first half of 2025. Since then, the AI infrastructure buildout has only intensified. For now, at least, there appears to be no end in sight.
Today’s earnings surge is, at least in part, being driven by this enormous capital investment boom. The first-order effect is straightforward: capital spending by one company becomes revenue and earnings for another. But that income doesn't stop there. Suppliers hire workers, purchase inputs, expand capacity, and make investments of their own, turning the income created by the original spending into additional spending elsewhere.
This creates a multiplier effect as the workers they hire and the businesses they buy from spend and invest some of that income themselves, creating successive rounds of spending and income that ripple throughout the economy. These second-order effects allow the earnings benefits of the boom to spread far beyond the companies receiving the initial orders.
The scale of this investment boom is truly remarkable. Technology companies have collectively spent, or committed to spend, more than a trillion dollars on artificial intelligence infrastructure already, with announced capital expenditure budgets growing almost monthly. Yet even those extraordinary figures understate the scale of the commitments being made. Increasingly, companies are also entering into long-term contractual commitments – including leases, purchase agreements, and energy contracts – that extend many years into the future.
Financing these commitments has required firms that historically relied primarily on internally generated cash to increasingly tap both the equity and debt markets. Some have announced secondary offerings measured in the tens of billions of dollars. Others have materially increased leverage to finance data centers, specialized semiconductors, networking equipment, and power infrastructure on a scale rarely seen outside of traditional industrial businesses. Increasingly creative financing structures are also expanding the pool of capital available to finance the buildout even further. Companies once celebrated for their asset-light business models are rapidly becoming some of the world's largest investors in physical infrastructure.
Taken together, these developments have produced one of the largest capital investment waves in modern history. Yet something about the resulting prosperity deserves closer attention. While the earnings benefits of this enormous investment are spreading throughout the economy, the companies making the investments themselves remain highly profitable today despite unprecedented capital spending. Financial markets have rewarded both groups, reinforcing the impression that the investment boom is generating extraordinary prosperity almost everywhere and all at once.
History suggests there is nothing unique about this pattern. Railroads generated enormous demand for steel, locomotives, bridges, and construction. Electrification transformed manufacturing while creating vast opportunities for equipment suppliers and utilities. The dotcom boom produced unprecedented orders for fiber-optic cable, networking equipment, and switching hardware. Today's artificial intelligence boom has followed a remarkably similar path.
Figure 1: Average Annual Investment During CAPEX Booms as a Share of U.S. GDP
The Projected AI Buildout Would Rival America’s Largest Infrastructure Booms
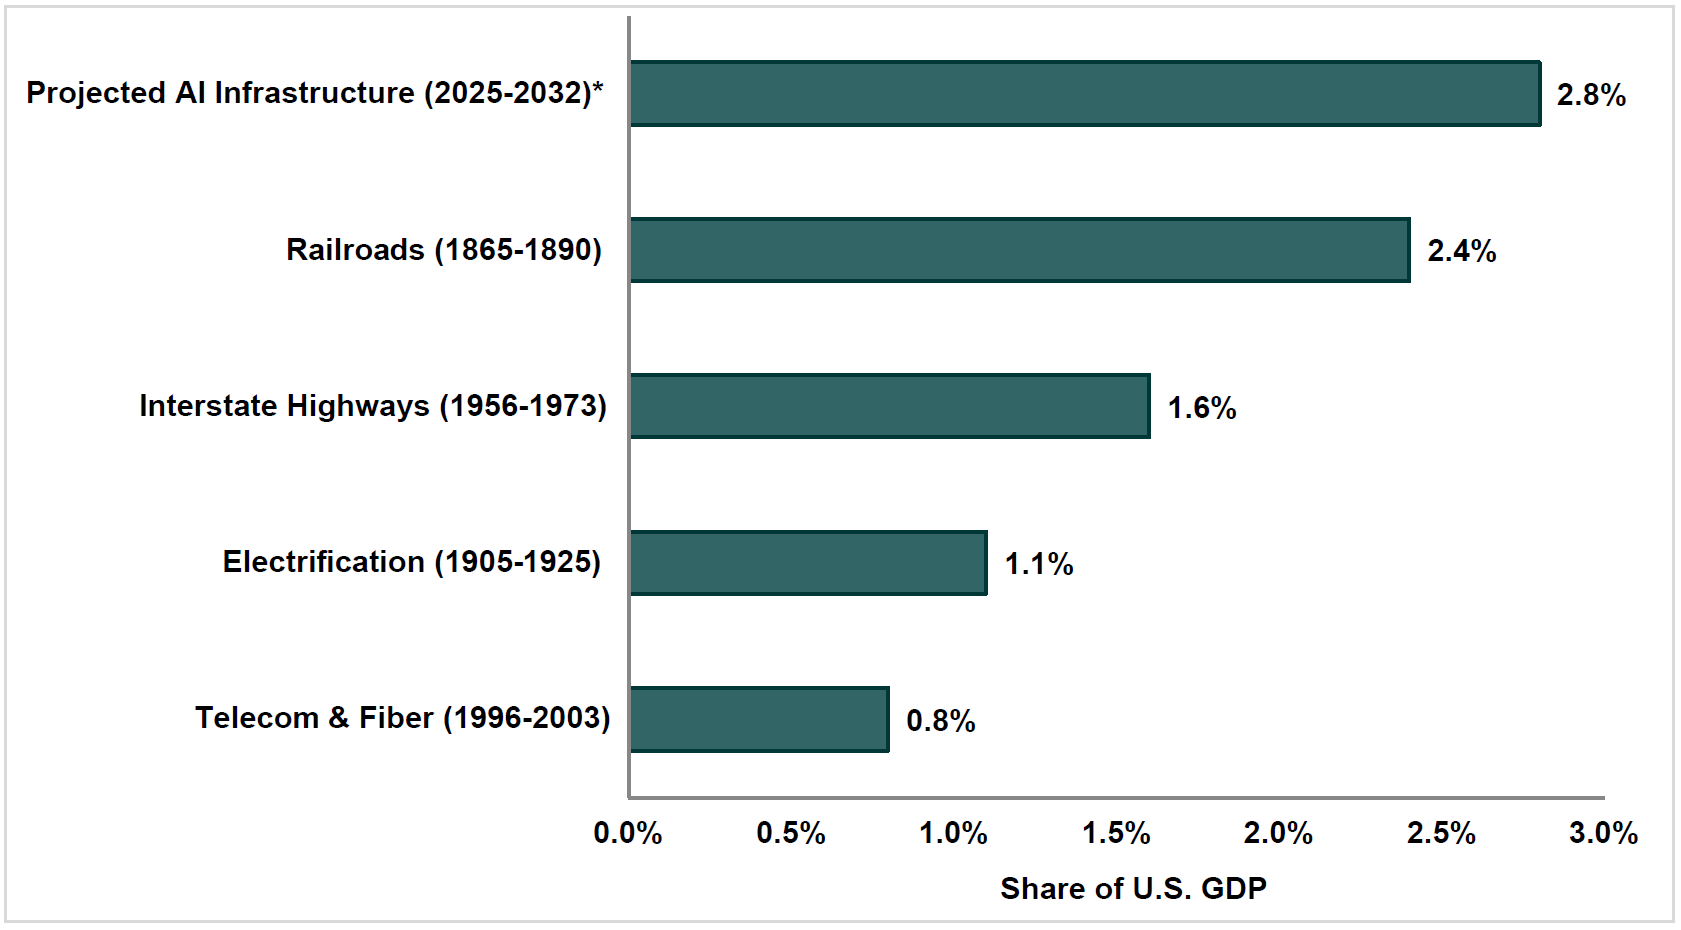
Source: SaratogaRIM, using data from Stijn Van Nieuwerburgh, "Financing the AI Buildout," Columbia Business School Working Paper, March 19, 2026. Historical infrastructure episodes are shown as realized average annual investment as a share of U.S. GDP over the periods indicated. The AI infrastructure figure (*) is a forward-looking estimate based on projected U.S. investment required to support anticipated artificial intelligence computing infrastructure. Comparisons are intended to illustrate the relative scale of investment rather than predict actual expenditures or investment outcomes. See Disclosures.
There is nothing mysterious about any of this. Transformative innovations stimulate investment, generate economic growth, and produce strong earnings. Yet that explanation is incomplete. The remarkable feature of the beginning phase of nearly every major capital boom is that prosperity appears to spread almost everywhere simultaneously. Suppliers flourish while the companies making the investments continue reporting robust earnings despite unprecedented capital expenditures. Investors reward both groups, reinforcing the perception that an entire economy has suddenly become more profitable. Eventually, however, as the surge in capital expenditures subsides, that dynamic begins to reverse.
Why does this boom-and-bust cycle happen so consistently?
As noted earlier, part of the answer is economic. Capital investment creates income that ripples throughout the economy. But another important part of the answer lies in the way financial statements recognize investment.
Every major capital investment starts two financial clocks simultaneously – one for the companies supplying the investment and one for the companies making it. The first begins the moment capital is deployed, as the capital investment immediately becomes revenue for companies throughout the supply chain.
The second begins at the same moment but unfolds gradually over many years as the companies making those investments begin recognizing depreciation, financing costs, maintenance, and the ongoing economic burden associated with the new assets they have created. The accounting is doing exactly what it was designed to do. The two clocks are simply measuring different stages of the same economic process.
Understanding these two clocks helps explain one of the defining characteristics of every major capital investment boom. During the expansion phase, the economic benefits of new investment begin flowing almost immediately through the financial statements of the companies supplying the goods and services needed to build the new capacity. The associated economic costs, however, emerge much more gradually through depreciation, financing costs, maintenance, and other operating costs recognized in the financial statements of the companies making those investments. As a result, suppliers are recognizing much of today's economic benefits while the companies making those investments have yet to recognize much of tomorrow's costs. Neither set of financial statements is wrong. This timing difference explains why prosperity appears so broadly and simultaneously during the expansion phase.
This asymmetry has important implications for financial statement analysis. During ordinary periods, these timing differences tend to be much less significant. During one of the largest capital investment booms in modern history, however, they can temporarily make an entire economy appear considerably more profitable than it will on the other side of the cycle. Understanding where businesses sit within that investment lifecycle is therefore one of the central challenges facing investors during major buildouts.
For the companies supplying the goods and services that make the investment possible, the accounting is straightforward. A semiconductor manufacturer ships chips and recognizes revenue. A construction company completes part of a new data center and records sales. An engineering firm bills for design work. Utilities recognize revenue by supplying the power required for AI data centers. Each participant in the supply chain records revenue and, assuming the work is profitable, reports higher earnings almost immediately. Their financial statements reflect the economic benefits generated by the investment as the work is performed.
The investment flows through the investing company's financial statements very differently. Rather than recognizing the expenditure immediately as an expense, much of the spending is capitalized on the balance sheet as property, plant, and equipment. The accounting follows a fundamental principle of financial reporting: costs should generally be recognized during the periods in which they generate economic benefits. A data center expected to operate for decades should not reduce earnings only in the quarter it was built. Instead, its cost is allocated gradually over its useful life through depreciation.
That treatment is neither aggressive nor misleading. In fact, it is precisely what financial accounting is intended to accomplish. The matching principle exists because immediate expensing would produce a distorted representation of economic performance, depressing current earnings while overstating profitability in future periods. Earnings should reflect the productive use of long-lived assets, not just the timing of the cash outlay required to acquire them.
Yet this same accounting treatment has profound consequences during periods of extraordinary capital investment.
While suppliers recognize the economic benefits of new investment immediately, most of the associated cost has yet to be recognized by the investing company. Even after the data center becomes operational, only a small portion of its cost has been recognized through depreciation. Most of the depreciation and, if it has been financed with debt, interest expense still lie ahead. The facility must also be staffed, maintained, repaired, powered, cooled, insured, and ultimately replaced. None of those future costs are absent from the economics. They simply emerge over a much longer timeframe than the initial revenues generated throughout the supply chain.
As a result, the financial statements of many different companies can simultaneously portray improving profitability even though they reflect different stages of the same investment lifecycle.
This distinction is easy to overlook because most investors naturally focus on the income statement. Quarterly earnings dominate financial headlines, management discussions, and analyst estimates. Thorough financial statement analysis, however, requires a broader view. The balance sheet, income statement, and statement of cash flows are not independent reports. They form an integrated accounting system. In financial statement analysis, this relationship is known as articulation. A single economic event ultimately appears on all three financial statements, but often at different times and in different forms. Understanding how economic events migrate through the financial statements over time lies at the heart of good financial statement analysis. During ordinary periods, those relationships can seem routine. During extraordinary investment booms, they become essential to understanding what the financial statements are – and are not – telling investors.
The current artificial intelligence investment cycle provides an unusually clear illustration of articulation in practice. Reported net income continues to rise. Capital expenditures have accelerated to unprecedented levels. Yet free cash flow is already starting to tell a noticeably different story. None of these financial measures is incorrect. Understanding how – and why – they can all be true simultaneously is precisely what financial statement analysis seeks to explain.
Figure 2: Net Income, Capital Expenditures, and Free Cashflow of “Hyperscalers” (AMZN, GOOGL, META, MSFT, ORCL) and Semiconductor Companies (NVDA, MU, AVGO, AMAT) from 2010-2025

Source: FactSet, BofA Research Investment Committee, SaratogaRIM. See Disclosures.
The implications extend well beyond accounting. Without an understanding of these dynamics, investors often come to expect that companies with high margins, exceptional returns on invested capital, and abundant free cash flow will sustain those financial characteristics indefinitely.
Extraordinary capital investment can fundamentally alter the economics of the business itself. Companies that once generated extraordinary returns through relatively non-capital-intensive operations may suddenly find themselves investing hundreds of billions of dollars in data centers, electrical infrastructure, networking equipment, and specialized semiconductors. Assets accumulate rapidly on the balance sheet. Depreciation becomes a much larger component of future operating costs. Interest expense grows as companies increasingly supplement internally generated cash with debt financing. Future maintenance capital expenditures become a far more significant claim on cash flow than they were during the company's earlier stages of development.
Many of these investments may ultimately create substantial long-term value. That, however, isn’t the central issue. The point is simply that the financial characteristics of these businesses are changing along with their underlying economics. Historical measures of profitability, capital intensity, leverage, and free cash flow conversion may no longer reflect the economics that businesses are likely to exhibit over the next decade.
This distinction becomes particularly important during periods of rapid technological change. Investors naturally focus on the remarkable earnings being generated today, but today's earnings can sometimes reflect yesterday's business model rather than the evolving economics that will shape tomorrow's financial statements. As the investment cycle progresses, depreciation increases, maintenance requirements expand, financing costs accumulate, and competition intensifies as new capacity comes online. By the time those changes become fully visible in reported financial statements, investors have often shifted their attention to an entirely different set of questions, and market prices may have adjusted long before the accounting tells the full story.
Accounting and financial markets also often operate on different timelines. Financial statements recognize many costs gradually as assets are depreciated and financing costs emerge over time. Financial markets, however, often begin reassessing those future obligations much earlier. As leverage rises and financing requirements expand, credit markets frequently lead that reassessment as bond yields and credit spreads begin adjusting well before the associated costs become fully visible in reported earnings. Financial markets don't wait for the second clock to catch up. They begin pricing those economic consequences long before the accounting fully reflects them.
This phenomenon is not unique to artificial intelligence. Every major capital investment cycle follows a remarkably similar pattern. The technologies change, the accounting doesn’t.
The railroad boom of the nineteenth century generated extraordinary demand for steel, locomotives, bridges, engineering services, and construction. Suppliers prospered as railroads expanded across continents. Railroads initially reported strong growth as new lines opened and traffic increased. Yet the economic consequences of those enormous investments continued unfolding long after the initial construction boom had passed. Depreciation, maintenance, financing costs, and growing competition gradually transformed the industry's economics in ways that would have seemed almost inconceivable at the height of the boom.
Electrification followed a remarkably similar path. The buildout created tremendous opportunities for manufacturers of generators, turbines, transmission equipment, copper wire, and industrial machinery. Entire industries experienced years of exceptional growth as factories modernized and electrical infrastructure expanded. Once again, suppliers recognized the immediate benefits while the long-term costs of operating, maintaining, and replacing those assets unfolded only gradually over subsequent decades.
This pattern repeated itself during the dotcom boom of the late 1990s. Manufacturers of fiber-optic cable, networking equipment, switches, routers, and optical components experienced explosive demand as companies rushed to build the internet's physical backbone. Financial statements throughout the supply chain reflected extraordinary profitability. Once again, it was only after investment had slowed and excess capacity became apparent that depreciation, financing costs, and intense competition abruptly reshaped the economics of the industry.
The artificial intelligence boom around us today appears to be following this same pattern. Whether the ultimate outcome proves more successful than previous investment booms remains to be seen. Technology may ultimately transform the global economy in ways that exceed today's expectations. The point isn’t that these investments will fail. The point is that the economic consequences of today's extraordinary capital investments will unfold over time much as they have during every major investment boom that preceded it.
This distinction becomes particularly important when evaluating businesses whose economics are undergoing fundamental change. Many of today's largest technology companies built their businesses around remarkably asset-light business models. High margins, exceptional returns on invested capital, modest capital expenditure requirements, and abundant free cash flow became defining characteristics of the industry's most successful firms. Investors have understandably come to view those financial characteristics as essentially permanent.
Increasingly, companies once known primarily for software, digital advertising, and cloud services are becoming owners and operators of enormous physical infrastructure. Data centers, specialized semiconductors, electrical systems, cooling equipment, networking hardware, and power generation are no longer peripheral investments. They are becoming central to the competitive landscape.
Moreover, the investment requirements increasingly extend beyond the data centers themselves. As rapidly growing demand for computing capacity strains existing power systems, additional investment in generation, transmission, and electrical infrastructure is expanding both the scale of the capital cycle and the economic consequences that will ultimately flow from it.
Financing these investments has required not only unprecedented levels of capital expenditure, but increasingly the use of both debt and equity financing by companies that historically relied far more heavily on internally generated cash. The effects of this investment cycle are already becoming apparent in the way free cash flow is migrating across the AI value chain.
Figure 3: Rolling 12-month Forward Free Cash Flow (in Billions) of "Hyperscalers" (AMZN, GOOGL, META, MSFT, ORCL) and Semiconductor Companies (NVDA, MU, AVGO, & AMAT)
A generational transfer in free cash flow is taking place.
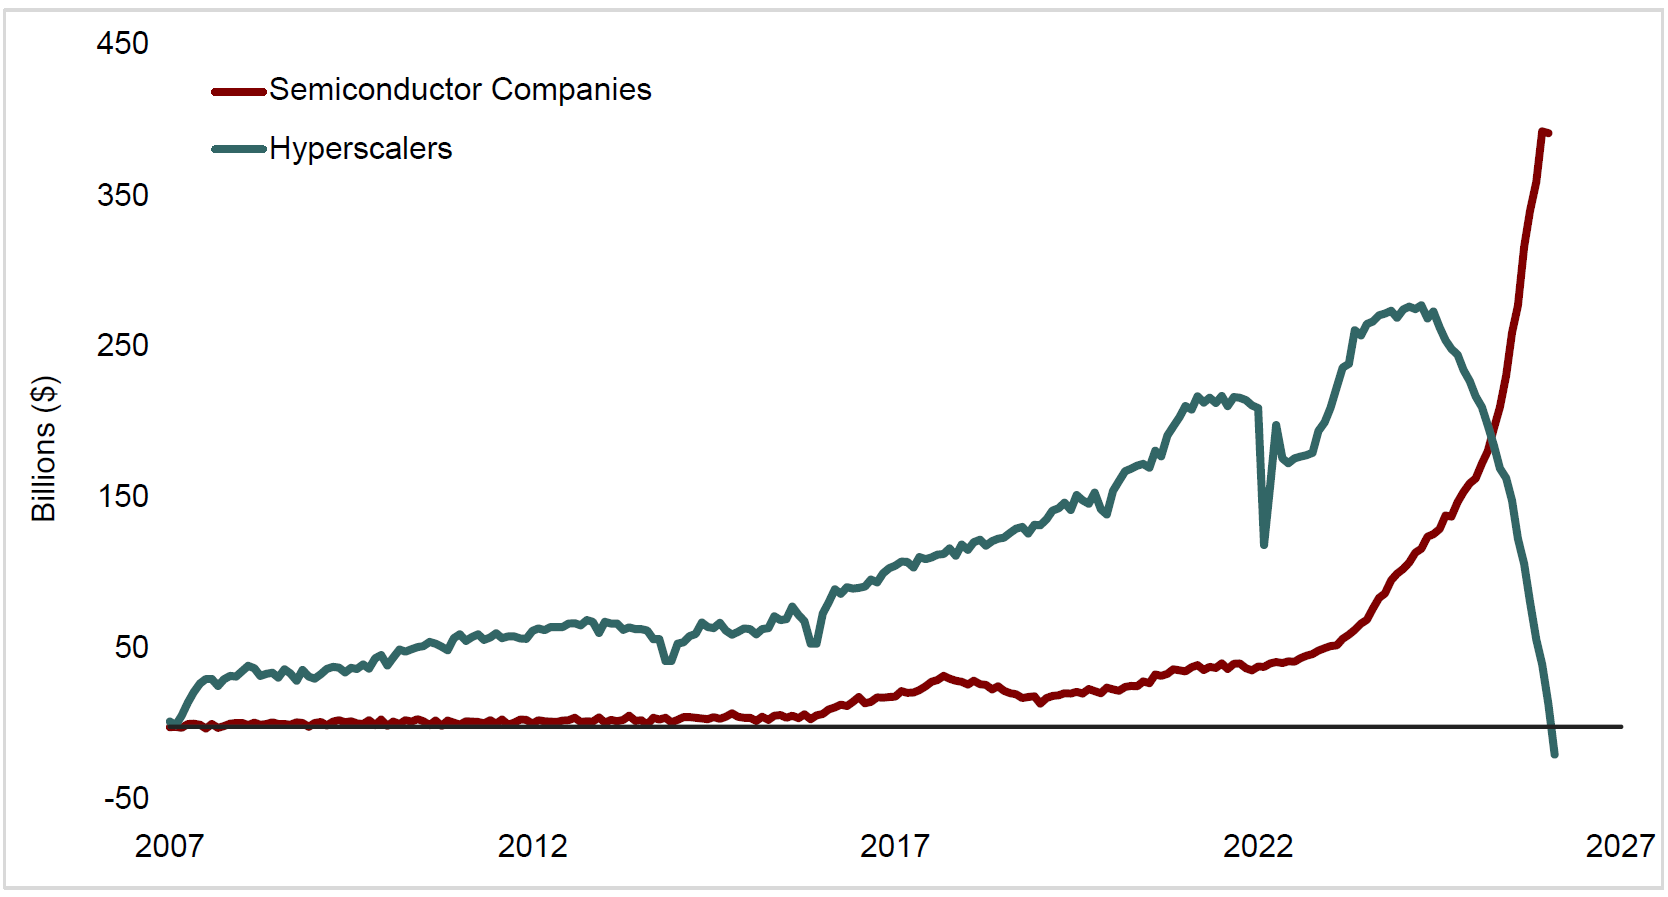
Source: SaratogaRIM, derived from chart created by BofA Research Investment Committee. See Disclosures.
The chart illustrates how the migration in free cash flow is a natural consequence of these investments. Capital expenditures are recorded immediately as cash outflows by the companies making the investments, reducing free cash flow, while those same expenditures become revenues, earnings, and ultimately free cash flow for the companies supplying the goods and services needed to build the new infrastructure.
The assets created by those capital expenditures accumulate on the investing company’s balance sheet as property, plant, and equipment, gradually giving rise to depreciation, financing costs, and future maintenance requirements. As those assets begin operating over their useful lives, they will produce progressively higher depreciation expense. Interest expense will rise as leverage increases, while maintenance capital expenditures will eventually consume a larger share of future cash flow.
These changes have important implications for financial statement analysis. Ratios that investors have long associated with exceptional businesses, including asset turnover, free cash flow conversion, and returns on invested capital, are not permanent attributes of a business. They are observations drawn from particular points in time, reflecting the economics of the business as it existed then. When those economics change, the associated financial ratios often change as well, reflecting a fundamentally different business model rather than deteriorating execution.
Investors who mechanically extrapolate yesterday's profitability into tomorrow may overlook the possibility that the business generating those earnings is no longer the same business it once was.
None of this suggests that artificial intelligence will prove disappointing. Quite the opposite. Railroads permanently transformed transportation. Electrification reshaped manufacturing. The internet revolutionized communication and commerce. Society ultimately benefited enormously from each of these investments, even if the financial returns ultimately earned by shareholders varied widely. The critical question is therefore not whether artificial intelligence creates value. It is whether investors fully appreciate how – and when – both that value and its associated costs will emerge in financial statements. Most importantly, it is whether, after massive runups over recent years, today's market prices already assume more future value than the underlying economics ultimately support.
Here is where financial statement analysis becomes more than an exercise in calculating ratios or projecting earnings. The objective is not merely to estimate next quarter's results more accurately than everyone else. It's to understand a business well enough to recognize when the financial characteristics that once defined it are beginning to change. Over time, investors who understand how the costs associated with capital investments gradually migrate from the balance sheet to the income statement are often far better positioned than those who focus exclusively on where earnings are likely to come in relative to consensus expectations.
This distinction has become particularly relevant during today's artificial intelligence investment boom. The issue isn't whether today's technology companies in aggregate will continue creating enormous value, but how some of their rapidly evolving business models will reshape their future financial characteristics. This is a key risk for long-term investors to consider.
Every capital investment cycle eventually reaches a point at which the pace of new investment begins to slow. Markets become saturated, financing becomes more expensive, demand proves less robust than anticipated, or companies simply conclude that enough capacity has already been built. Whatever the cause, the first clock inevitably begins to slow. The second clock, however, continues gathering momentum.
Once construction slows, the economics of the investment don't simply disappear. The factories and data centers continue operating. Equipment still requires maintenance. Interest expense remains an obligation until debt is repaid, while depreciation continues reducing reported earnings regardless of whether demand ultimately meets expectations. Years of capital investment continue generating economic consequences long after the pace of new investment begins to slow.
This is the point at which the relationship between the two clocks begins to reverse. During the expansion phase, the first clock produces an immediate surge in revenues for companies selling into the investment boom while the second clock has only begun recognizing the costs borne by the companies making those investments. As the pace of new investment moderates, however, the first clock slows while the second often continues accelerating as completed projects enter service and begin generating depreciation, maintenance, financing, and other operating costs. Revenues respond quickly. The bulk of expenses arrive much later.
Importantly, capital investment does not even have to decline for the first clock to begin slowing. What matters to suppliers isn’t just the level of investment, but the rate at which that investment is growing. Capital expenditures can continue reaching new records even as the incremental demand they create starts to slow. For suppliers whose financial statements have benefited from years of accelerating investment, that deceleration alone can materially change the trajectory of revenues and earnings.
The effects can become considerably more pronounced as the cycle turns. During the boom, rapidly rising demand can push against available capacity, increasing utilization, strengthening pricing power, and expanding supplier margins. Those unusually attractive economics encourage suppliers to add capacity of their own. Because that capacity takes time to build, however, it may not become available until the growth in investment spending has already begun to slow.
On the other side of the cycle, the financial effects can therefore reverse surprisingly quickly. As new supply brings capacity closer to equilibrium with demand, utilization can fall, pricing power can weaken, and margins can contract. Supplier earnings may then deteriorate much faster than the underlying level of investment would suggest, even while absolute capital spending remains historically high. There is a reason these types of massive capital investment cycles have so often been described as boom-and-bust cycles.
Together, these dynamics help explain why the transition from boom to bust often feels so abrupt. Investors frequently attribute the deterioration to a sudden change in sentiment or an unexpected economic shock. In reality, the financial statements may simply be reflecting a different stage in the life cycle of the same investments. Supplier revenue growth can slow and margins can contract just as depreciation, maintenance, financing, and other costs associated with years of investment become increasingly visible elsewhere in the financial statements.
For investors, recognizing this transition may be even more important than forecasting the next quarter's earnings. During the expansion phase, it is relatively easy to identify the companies benefiting most from rising investment. The more difficult task is recognizing when the first clock is beginning to slow while the second continues gathering momentum. By the time that transition becomes fully visible in reported financial statements, investors have often moved on to an entirely different narrative.
Perhaps the most valuable application of financial statement analysis is understanding how, why, and when the underlying economics of a business are changing – and recognizing those changes before they become fully apparent in the financial statements. Reported earnings are important, but they rarely tell the entire story. As businesses evolve, so do their balance sheets, financing structures, capital intensity, and operating economics. Financial statements faithfully record every stage of that evolution, but the significance of those changes often becomes apparent only over time.
Major capital investment booms make this challenge particularly difficult because they encourage investors to extrapolate recent experience far into the future. Rising revenues, expanding margins, and optimistic guidance reinforce one another, creating the impression that today's financial characteristics are permanent features of the business, even as the business model generating them may itself be changing.
For thoughtful investors, however, recognizing the transformative potential of a technology is only the beginning of the analysis. Equally important is understanding how the economics of that transformation will be reflected in financial statements over time. Suppliers and the companies making the investments may both report strong earnings simultaneously while operating on very different clocks. Distinguishing among them requires more than forecasting earnings growth. It requires understanding which clock each company is operating on.
Every major investment boom is different. The technologies change. The participants change. The opportunities change. Yet one characteristic remains consistent. Capital continues to operate on two clocks. One measures the immediate benefits created by new investment. The other records the costs that unfold gradually over years or even decades. Understanding the relationship between those two clocks cannot tell investors precisely how a particular investment boom will unfold, nor can it identify the eventual winners and losers with certainty. It can, however, provide a more complete framework for interpreting financial statements as businesses, industries, and investment booms evolve over time.
In the end, that’s the most important lesson. Financial statements do far more than record economic events. They reveal where those events reside in time. In normal periods, that distinction may seem unimportant. During extraordinary investment booms, it can shape the way investors perceive an entire economy. The numbers themselves are rarely the challenge. The greater challenge is recognizing which clock you’re reading – and of course, what time it is.
Appendix
The two clocks of capital illustrate one important implication of financial statement analysis: reported earnings often reflect where economic events reside in time. But timing is only part of the story. Financial statements also translate economic events through accounting rules, classifications, estimates, and judgments. The appendix that follows explores two recent examples of how that translation can materially affect reported earnings.
Reading Between the Lines of Financial Statements
How Accounting Rules and Management Judgment Shape Reported Earnings
Financial statements are among the most important tools available to investors. They provide a common language for evaluating businesses, comparing performance across companies, and estimating intrinsic value. Without a common set of accounting standards, meaningful financial analysis would be nearly impossible.
Yet financial statements do more than record economic events. They measure them. Before an economic event becomes reported earnings, accounting standards and management judgment determine how that event will be reflected in the financial statements.
Most investors focus on headline numbers. Very few spend much time trying to understand how those numbers came to be. Yet in failing to do so, they can miss distinctions that materially affect how a business should be evaluated.
Two recent examples illustrate how and why.
Accounting Rules
Over the past two quarters, Alphabet reported billions of dollars of gains related to its investment in Anthropic, one of the world's leading artificial intelligence companies. Those gains represented more than half of Alphabet's reported earnings during each of the past two quarters. Amazon, whose investment in Anthropic is believed to be somewhat larger than Alphabet’s, likewise benefited from the company’s rapidly increasing private-market valuation. With Anthropic reportedly considering an initial public offering at a valuation approaching $2 trillion, the potential magnitude of these accounting effects could become considerably larger still. Furthermore, because both companies are among the largest constituents of the S&P 500 index, these accounting gains also represent a meaningful contribution to the reported earnings growth of the S&P 500 index itself.
Those are remarkable facts.
Without generating a single dollar of realized earnings, a private company's financing rounds materially influenced the reported earnings of two of the world's largest public companies while simultaneously affecting one of the most closely watched measures of corporate profitability in the world: the earnings of the S&P 500.
Most investors naturally focused on the headline numbers themselves. Few take the time to examine how and why these gains appear in reported earnings in the first place. The answer stems less from the economics of Anthropic than from the accounting rules governing how investments are reported.
To understand why, consider a simplified example.
Imagine two companies each invest approximately one-fifth of the equity of the same rapidly growing private business.
One acquires a 19.9% ownership interest.
The other acquires 20.1%.
Economically, the difference is almost meaningless. Each investor owns roughly one-fifth of the company. Each benefits if the business becomes more valuable. Each participates in substantially the same underlying economics.
Accounting, however, can treat those two investments very differently. Depending on the circumstances, the 19.9% investment may be reported under the fair value method, while the 20.1% investment may qualify for the equity method because ownership of approximately twenty percent generally creates a presumption that the investor exercises "significant influence" over the business. Under the fair value method, changes in its value flow directly into reported earnings. Under the equity method, the investor generally recognizes only its proportionate share of the investee's reported earnings or losses.
The implications of this accounting difference are striking. Suppose the underlying company in our hypothetical is still investing aggressively in future growth and reports little or no current profit. It may even be generating significant operating losses. Under the fair value method the 19.9% investor could recognize potentially substantial gains associated with any changes in the market value – public or private – of its investment. Under the equity method, the 20.1% investor would instead report only its share of the company's operating gains or losses. It wouldn’t record any of the unrealized gains or losses in market value on the investment.
The underlying investment is the same. The economics are virtually identical. Only the accounting treatment – and therefore the reported earnings – is different.
In the cases of both Alphabet and Amazon, had they owned 20% and been deemed to possess significant influence instead of the mid-teens ownership that they actually had, their reported earnings would have been more than 50% lower than actually reported. Nor would the impact have been confined to Alphabet and Amazon. It would have materially lowered the earnings of the entire S&P 500 due to their sheer size.
The purpose of this example wasn’t to teach the finer points of investment accounting. It was to illustrate a broader lesson. Before reacting to reported earnings, investors should try to understand the accounting rules that produce them. Sometimes the most important information isn’t found in the reported number itself, but in the accounting methodology used to determine it.
Management Judgment
Accounting rules, however, tell only part of the story.
Financial statements aren’t just shaped by accounting standards, they also depend on management's judgment. Along with their quarterly earnings report, Microsoft recently provided a useful illustration when management announced that they had decided to extend the estimated useful lives of certain data center assets from fifteen years to twenty-five years.
Nothing about the physical assets changed when Microsoft revised its estimate. The data centers didn’t suddenly become newer – the only thing that changed was the accounting estimate. By extending the estimated useful lives of those assets, Microsoft reduced the amount of depreciation expense that will be recognized each year going forward. Lower depreciation expense will increase reported earnings even though the underlying economics of the business remained largely unchanged.
Was Microsoft's estimate reasonable?
Maybe. Maybe not. The key issue is that no accounting standard can answer that question with certainty because it depends on the future. How long will these assets remain economically useful? No one knows. For now, the accounting reflects management’s judgment.
This issue also recently came up when investor Michael Burry (of The Big Short) publicly argued that certain artificial intelligence GPUs may become economically obsolete far more quickly than many companies are currently assuming. Whether his conclusion ultimately proves correct is almost beside the point. His comments simply illustrate that reasonable people can legitimately disagree about the economic lives of rapidly evolving technologies.
Accounting nevertheless requires management to choose a single estimate today. Those estimates directly influence reported earnings, even though their accuracy may not be known for many years.
Unlike accounting classification, which is largely governed by established rules, estimates require judgment. They reflect management's best assessment of an uncertain future based upon the information available at the time. As new information emerges, those estimates may change. When they do, reported earnings change along with them.
Reading Between the Lines
The two examples in this essay involve different accounting questions. The Anthropic example demonstrates how accounting rules can materially influence reported earnings. The Microsoft example demonstrates how management judgment can materially influence reported earnings. Together, they illustrate that understanding reported earnings often requires looking beyond the reported numbers to the accounting that produced them.
Neither example suggests that the accounting is flawed. Accounting standards are designed to provide investors with a consistent framework for measuring economic activity. Management estimates are unavoidable because financial reporting often requires judgments about events that will not be fully known for many years.
The lesson for investors is a different one. Reported earnings shouldn’t be viewed as the end of the analytical process. They are just the beginning. Understanding a business requires more than reading the income statement. It requires understanding the accounting policies, classifications, estimates, and judgments that produced the reported numbers. Often, the most important information is found not in the headline earnings figure, but in the notes that explain how those earnings were measured.
Financial statements remain among the most valuable tools available to investors. But to use them well, investors must learn to read between the lines.
Editor's Note
This essay is part of our ongoing Latticework Series, which examines today's investment environment through the lenses of multiple disciplines. Previous essays explored behavioral finance, neuroscience, and microeconomics. This essay approaches the same broad questions through the lens of financial statement analysis, focusing on how major capital investment cycles are reflected in reported financial results over time.
Complex investment problems rarely yield to a single discipline. Our objective is not to replace one framework with another, but to build a broader latticework of mental models in which each discipline contributes insights that the others cannot.
The previous essay examined how extraordinary capital investment and increasing competition can reshape the economics of businesses and industries. This essay builds on that foundation by examining how those same capital investment cycles flow through financial statements over time. The next essay in this series will examine these same questions through the lens of credit analysis, exploring how the cost and availability of capital influence businesses, markets, and investment outcomes.